Conversion tracking requires a Business plan
subscription or higher.
sale event happens when a user purchases your product or service. Examples include:
- Subscribing to a paid plan
- Usage expansion (upgrading from one plan to another)
- Purchasing a product from your online store

Looking to track sales without a prior lead event? Check out our direct sale tracking guide.
Prerequisites
First, you’ll need to enable conversion tracking for your Dub links to be able to start tracking conversions:Option 1: On a workspace-level
Option 1: On a workspace-level
To enable conversion tracking for all future links in a workspace, you can do the following:
To enable conversion tracking for all future links in a workspace, you can do the following: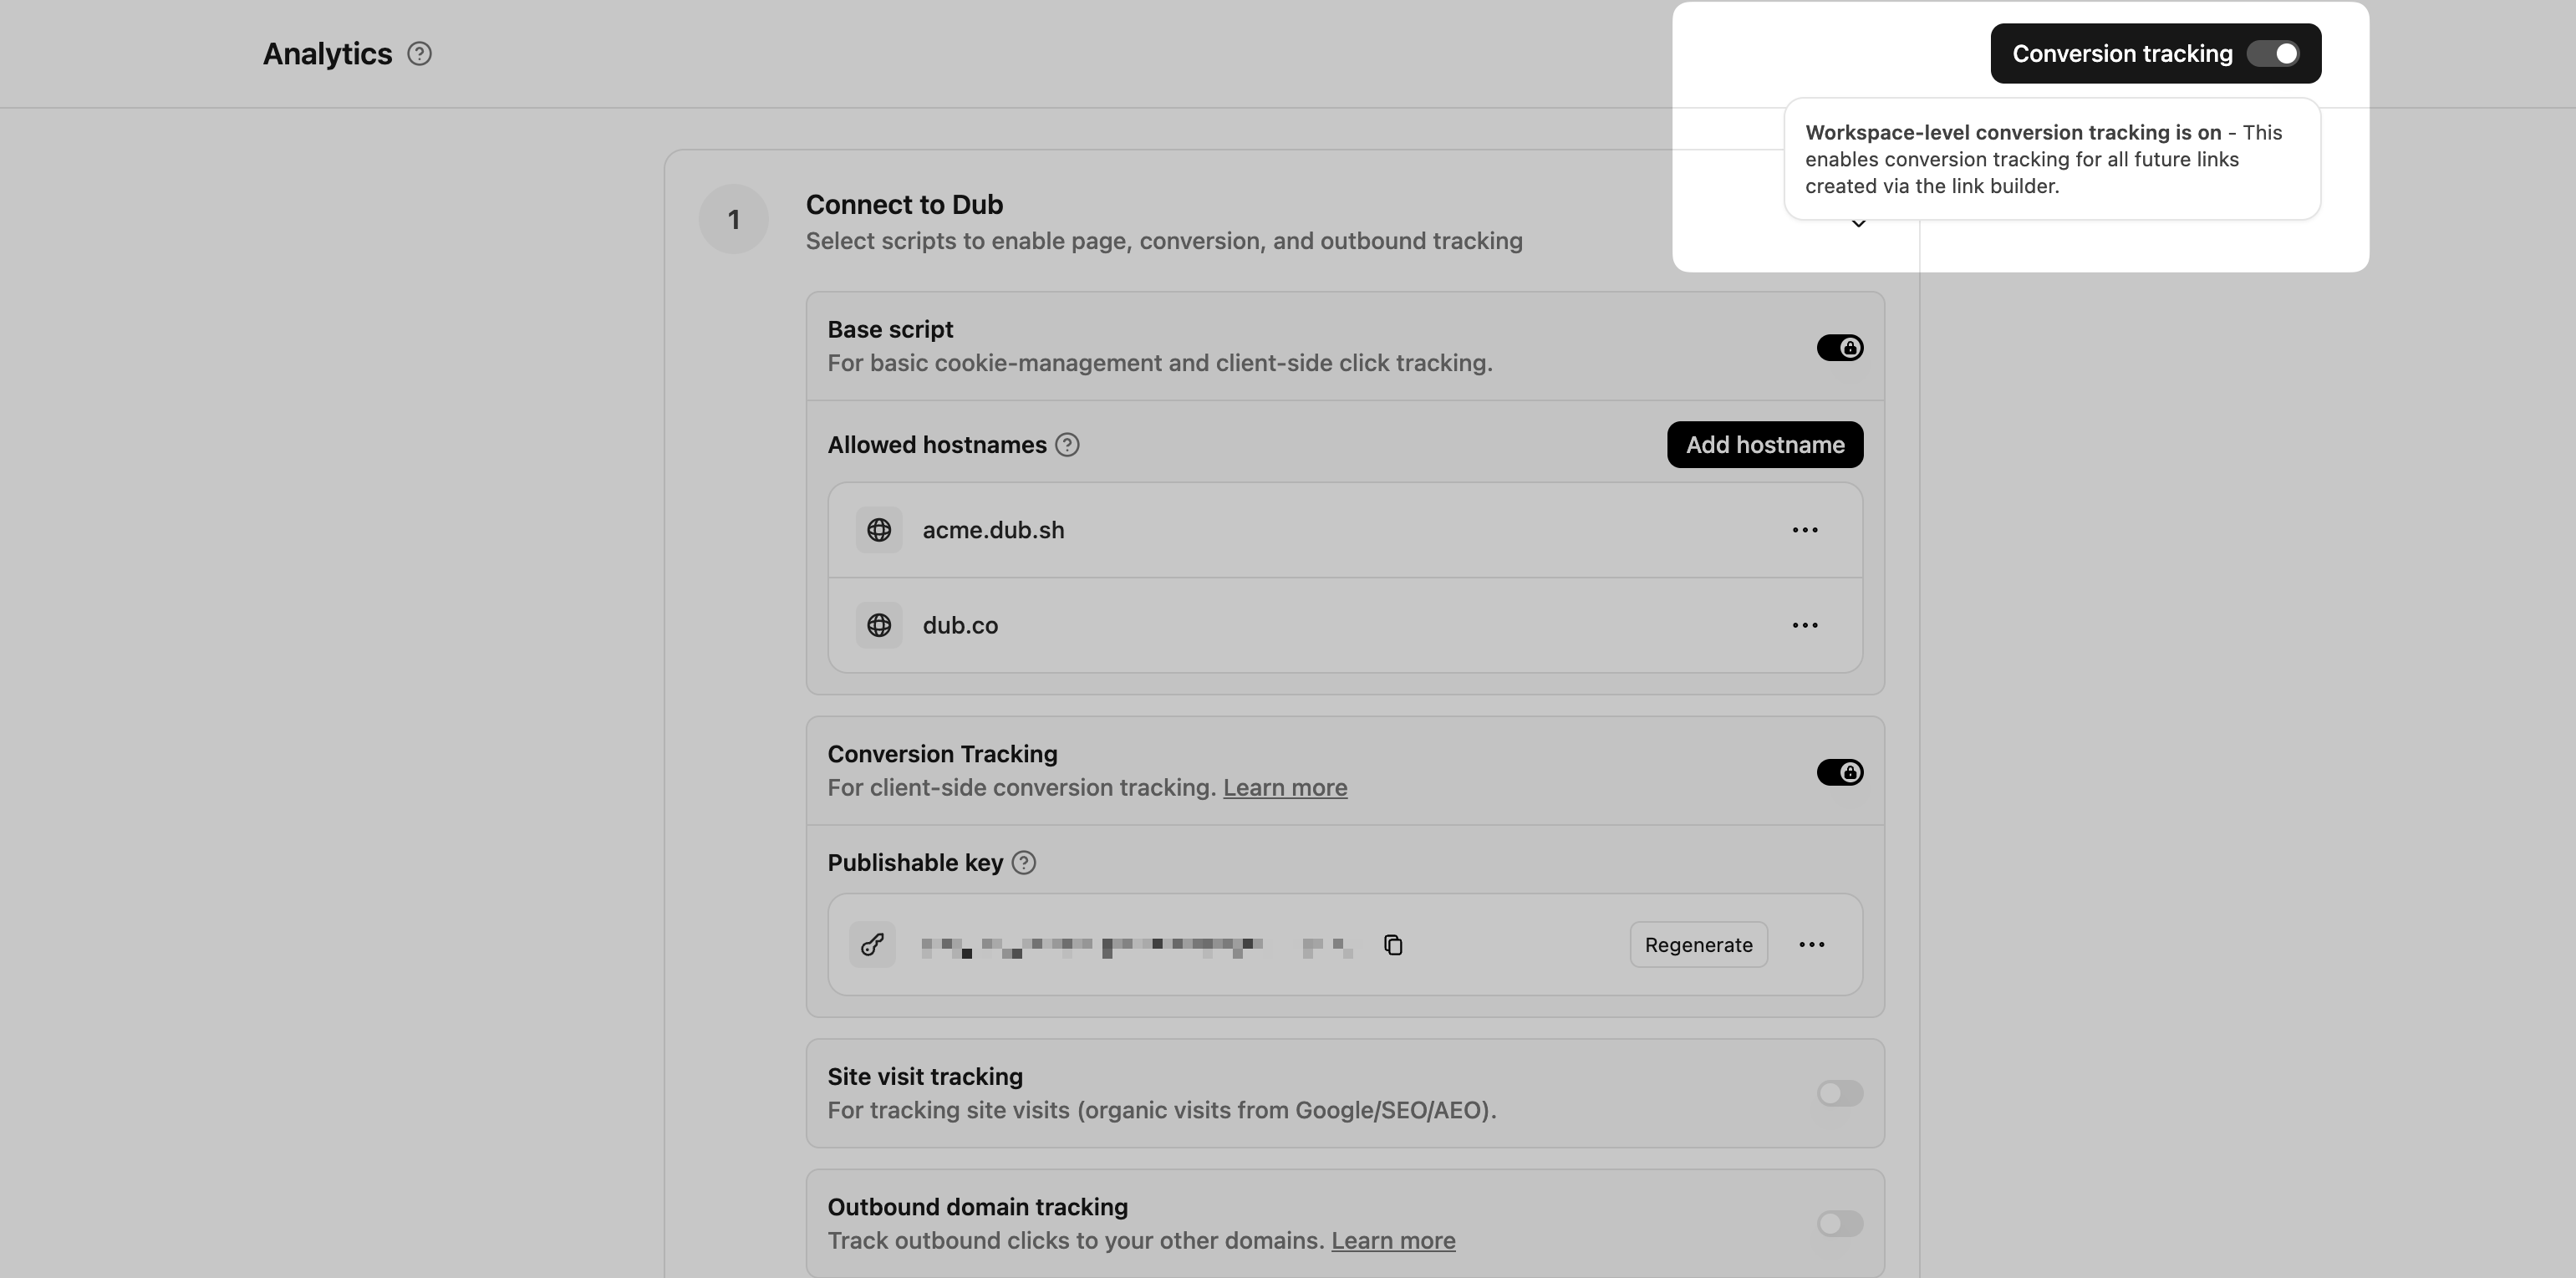
- Navigate to your workspace’s Analytics settings page.
- Toggle the Workspace-level Conversion Tracking switch to enable conversion tracking for the workspace.

Option 2: On a link-level
Option 2: On a link-level
If you don’t want to enable conversion tracking for all your links in a workspace, you can also opt to enable it on a link-level.To enable conversion tracking for a specific link, open the Dub Link Builder for a link and toggle the Conversion Tracking switch.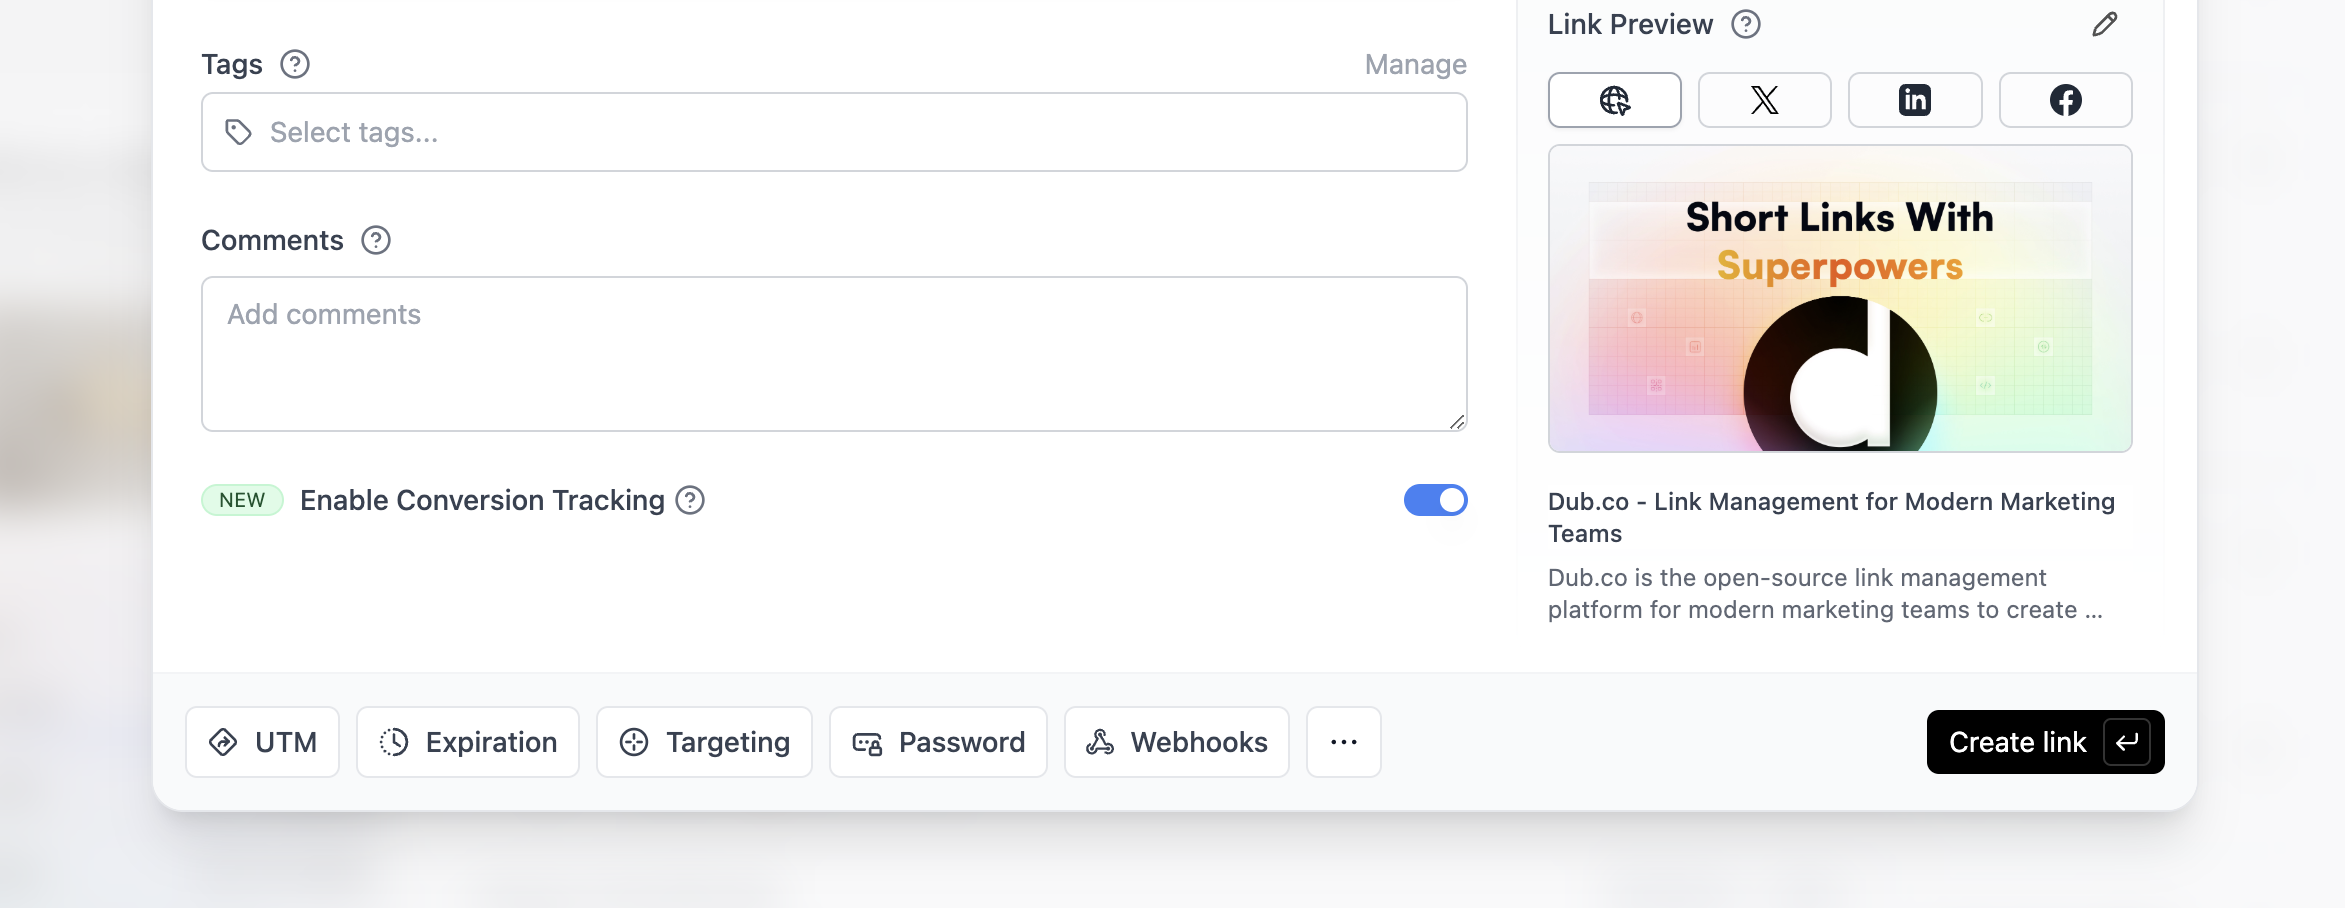

Option 3: Via the API
Option 3: Via the API
Alternatively, you can also enable conversion tracking programmatically via the Dub API. All you need to do is pass
trackConversion: true when creating or updating a link:@dub/analytics script to your website to track conversion events.
You can install the @dub/analytics script in several different ways:
You can verify the installation with the following tests:
- Open the browser console and type in
_dubAnalytics– if the script is installed correctly, you should see the_dubAnalyticsobject in the console. - Add the
?dub_id=testquery parameter to your website URL and make sure that thedub_idcookie is being set in your browser.
- The analytics script was added to the
<head>section of the page - If you’re using a content delivery network (CDN), make sure to purge any cached content
Step 1: Configure sale tracking
Next, depending on which payment processor you’re using, you can leverage our native integrations to track sale events:Stripe
Tracking sale conversion events with Stripe and the Dub SDK
Shopify
Tracking sale conversion events with Shopify and the Dub SDK
| Property | Required | Description |
|---|---|---|
customerExternalId | Yes | The unique ID of the customer in your system. Will be used to identify and attribute all future events to this customer. |
amount | Yes | The amount of the sale in cents. |
paymentProcessor | No | The payment processor that processed the sale (e.g. Stripe, Shopify). Defaults to “custom”. |
eventName | No | The name of the event. Defaults to “Purchase”. |
invoiceId | No | The invoice ID of the sale. Can be used as a idempotency key – only one sale event can be recorded for a given invoice ID. |
currency | No | The currency of the sale. Defaults to “usd”. |
metadata | No | An object containing additional information about the sale. |
clickId | No | [For direct sale tracking]: The unique ID of the click that the sale conversion event is attributed to. You can read this value from dub_id cookie. |
customerName | No | [For direct sale tracking]: The name of the customer. If not passed, a random name will be generated. |
customerEmail | No | [For direct sale tracking]: The email address of the customer. |
customerAvatar | No | [For direct sale tracking]: The avatar URL of the customer. |
Step 2: View conversion results
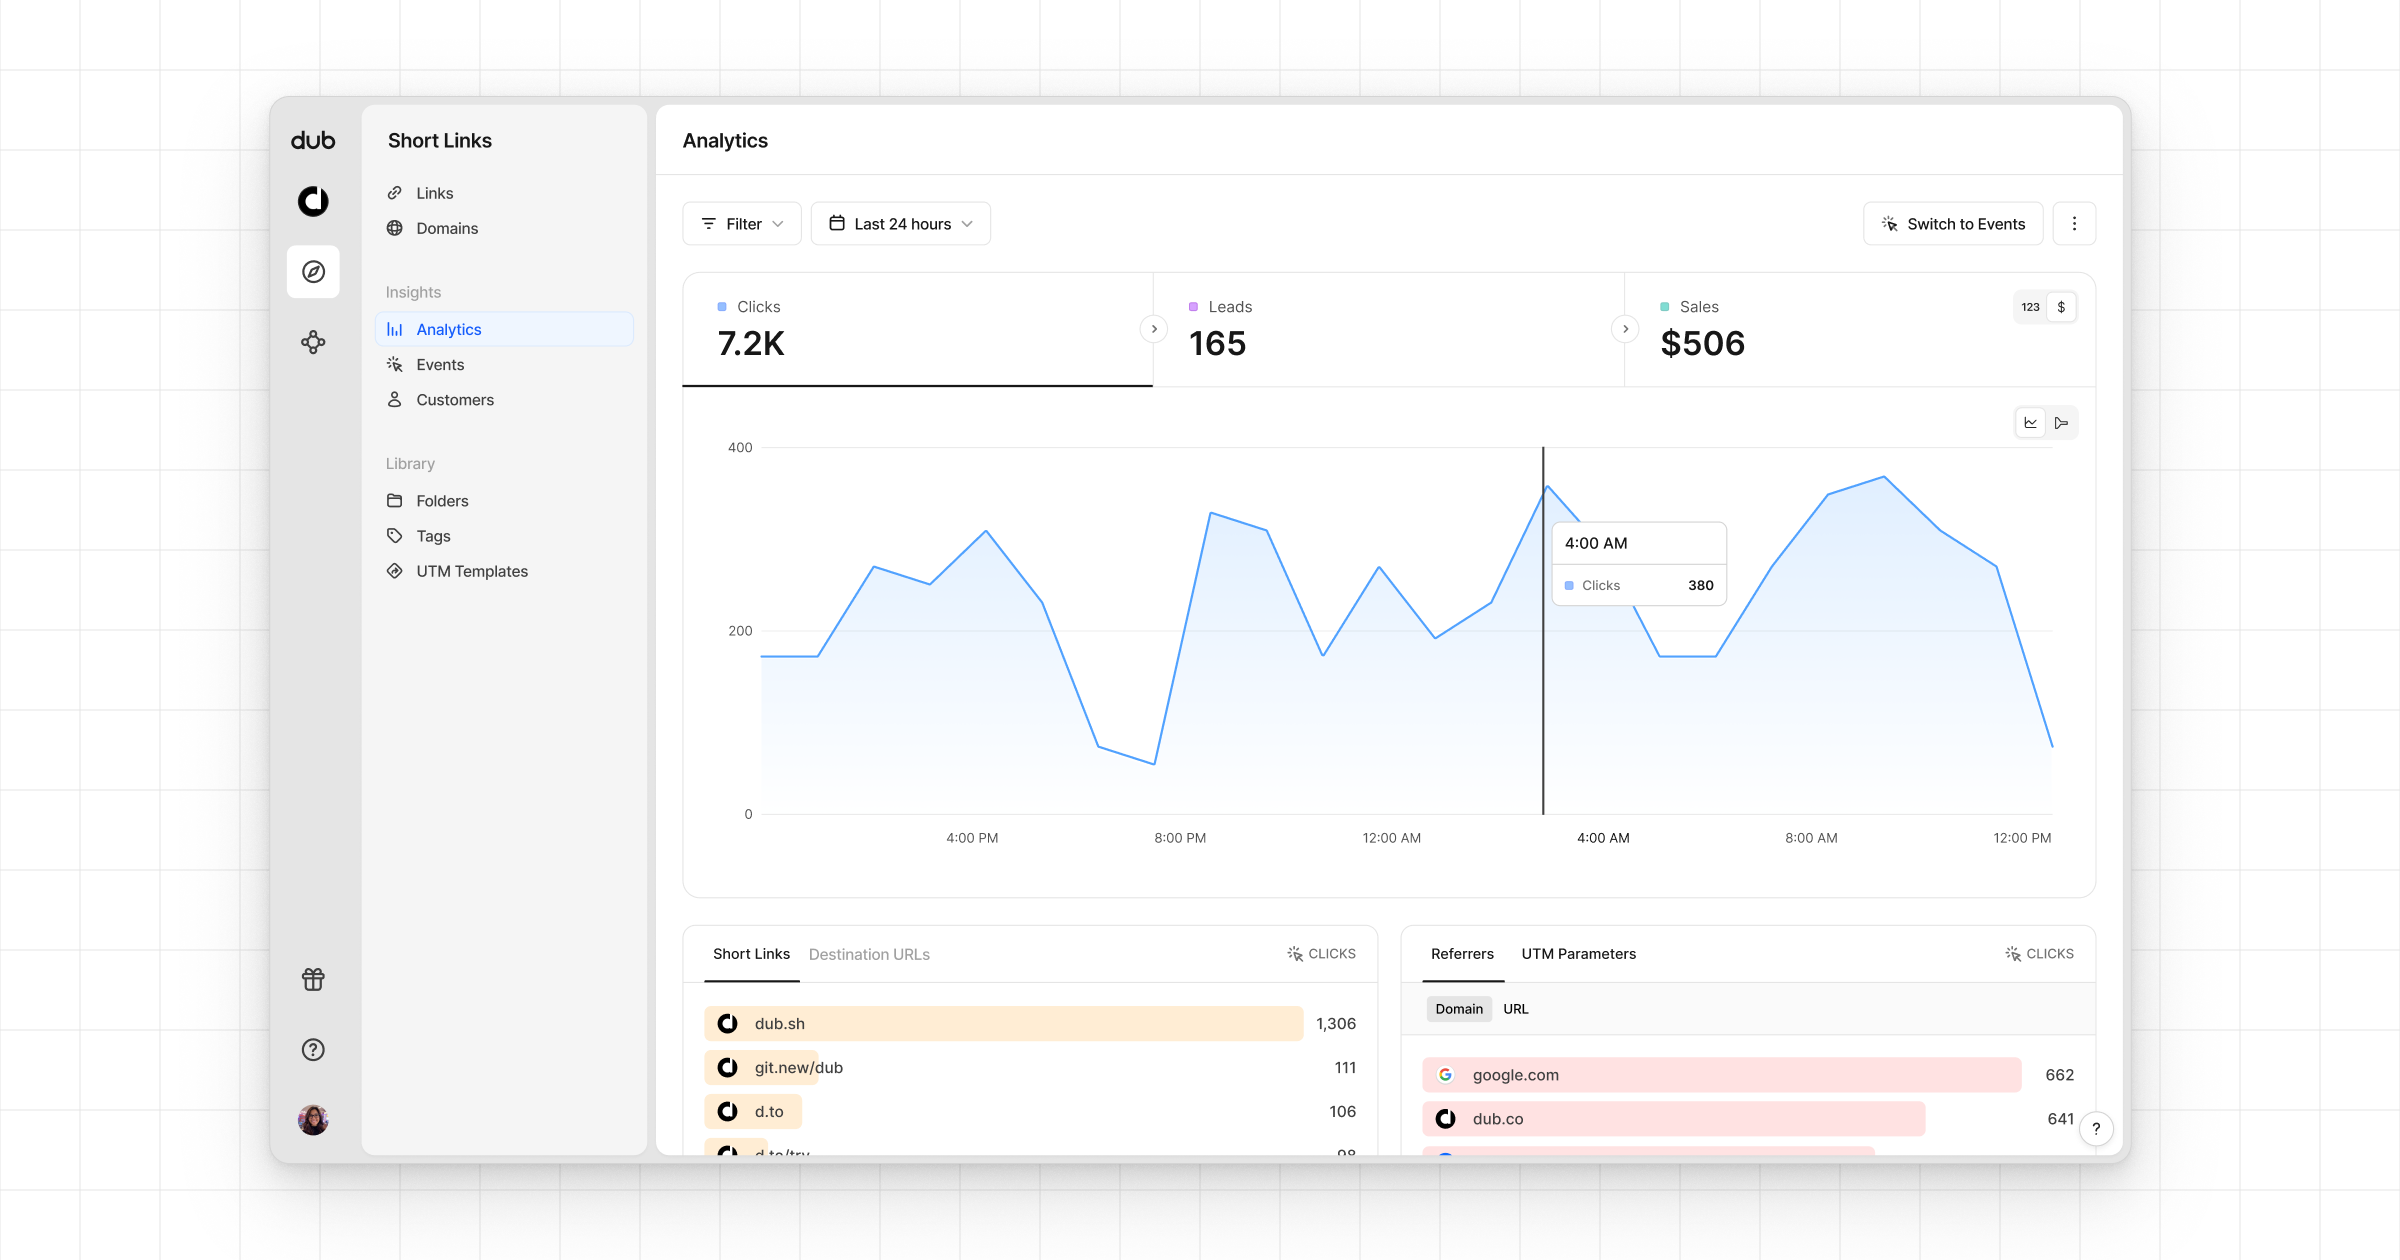
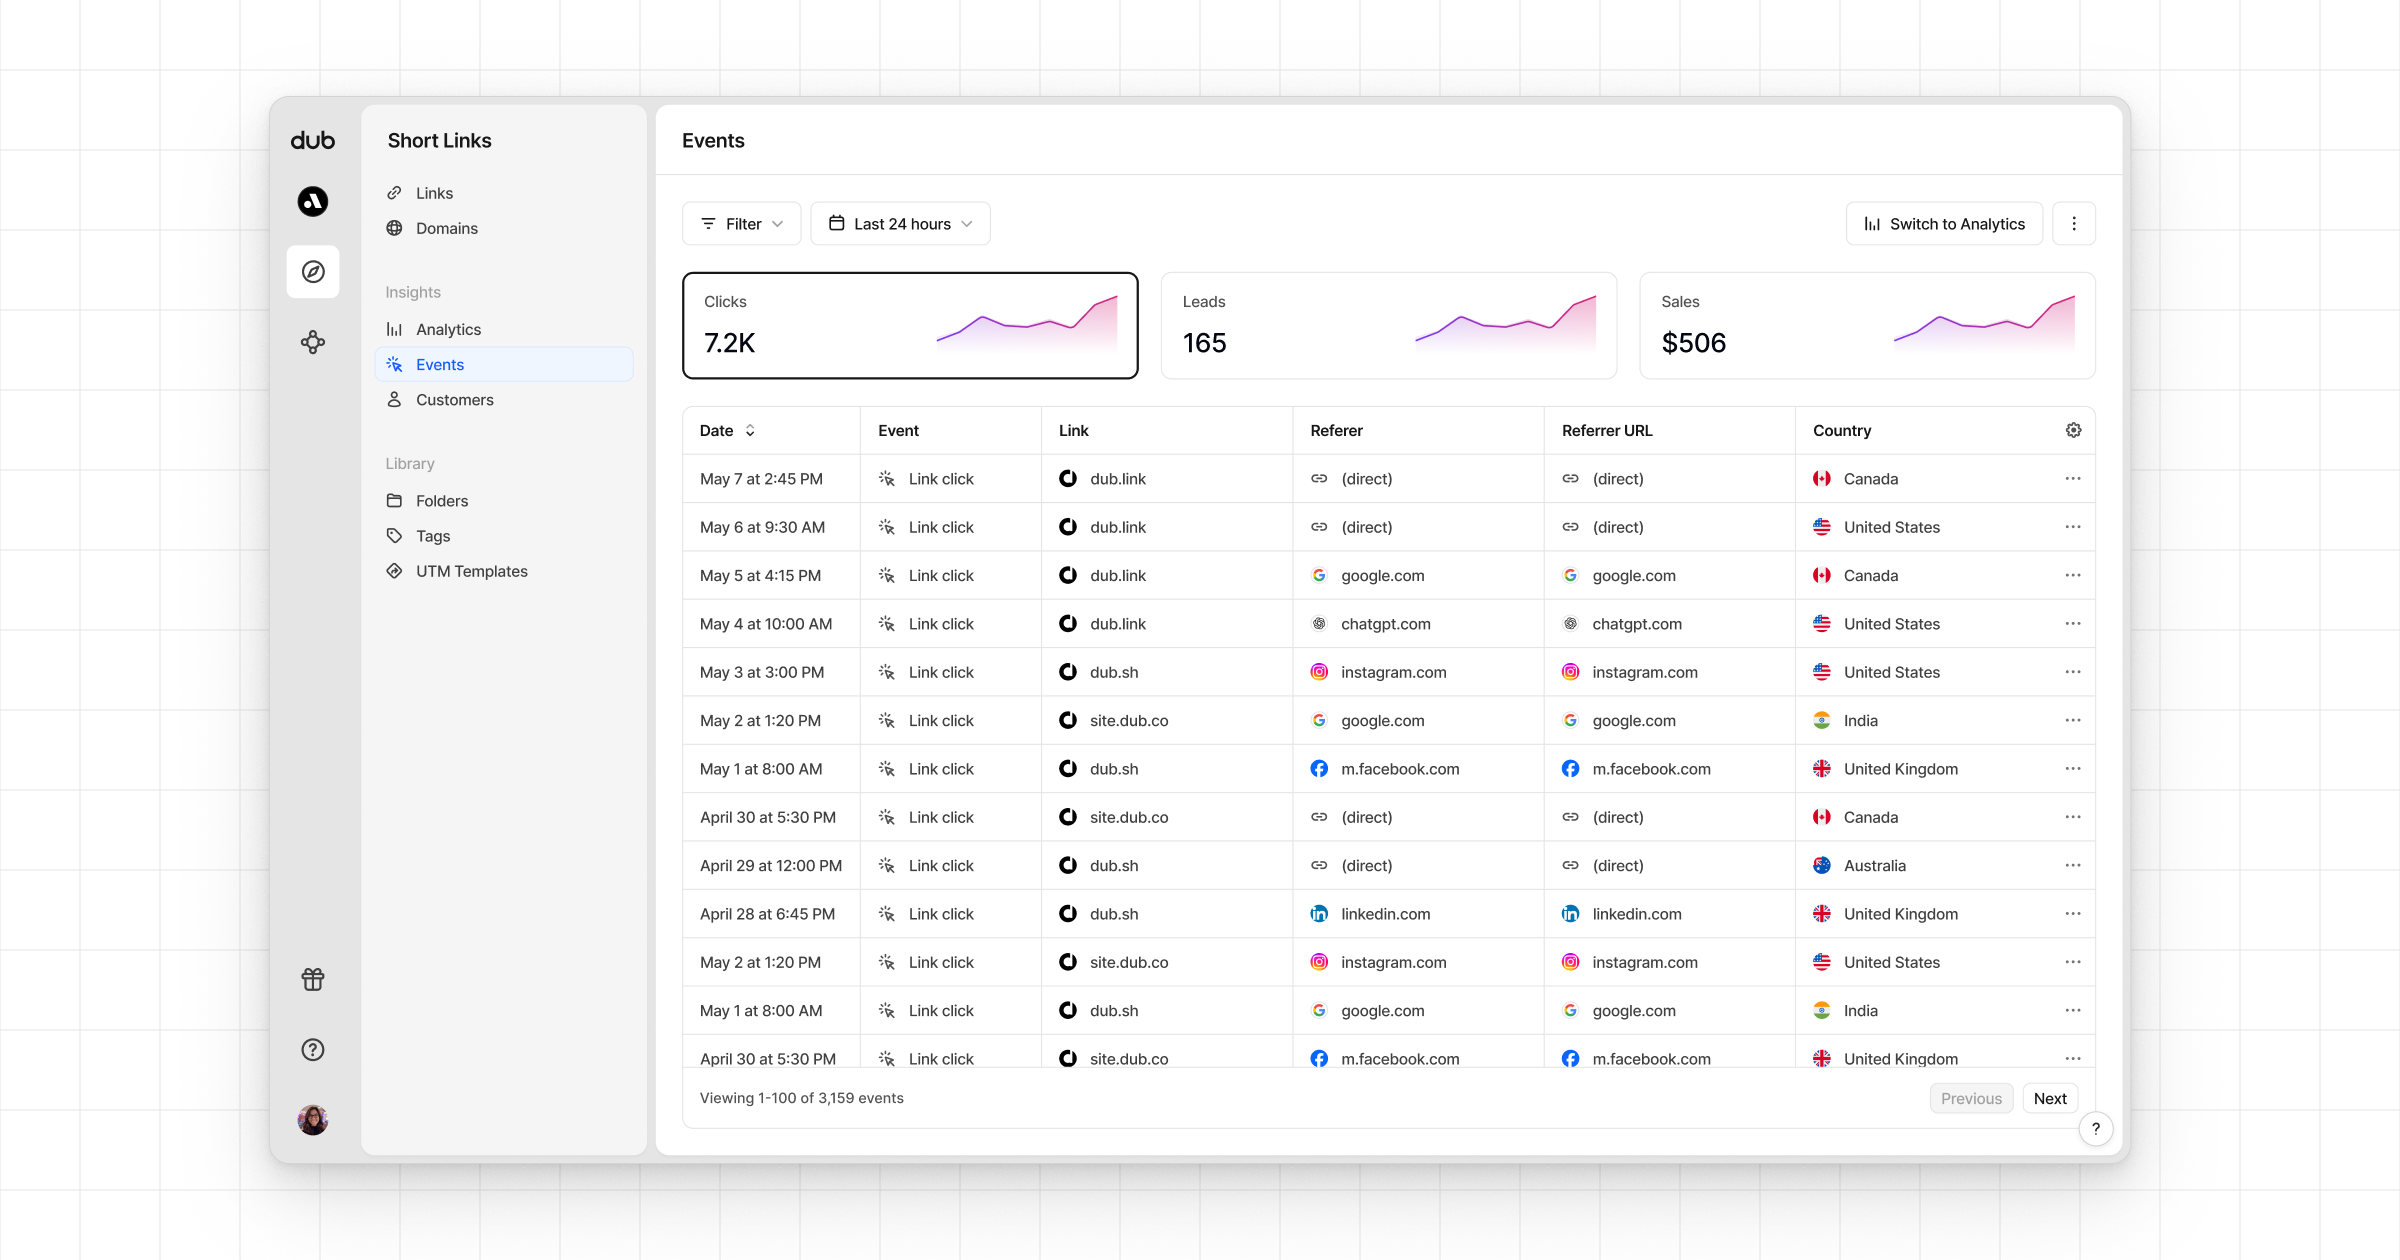
And that’s it – you’re all set! You can now sit back, relax, and watch your conversion revenue grow. We provide 3 different views to help you understand your conversions:- Time-series: A time-series view of the number clicks, leads and sales.
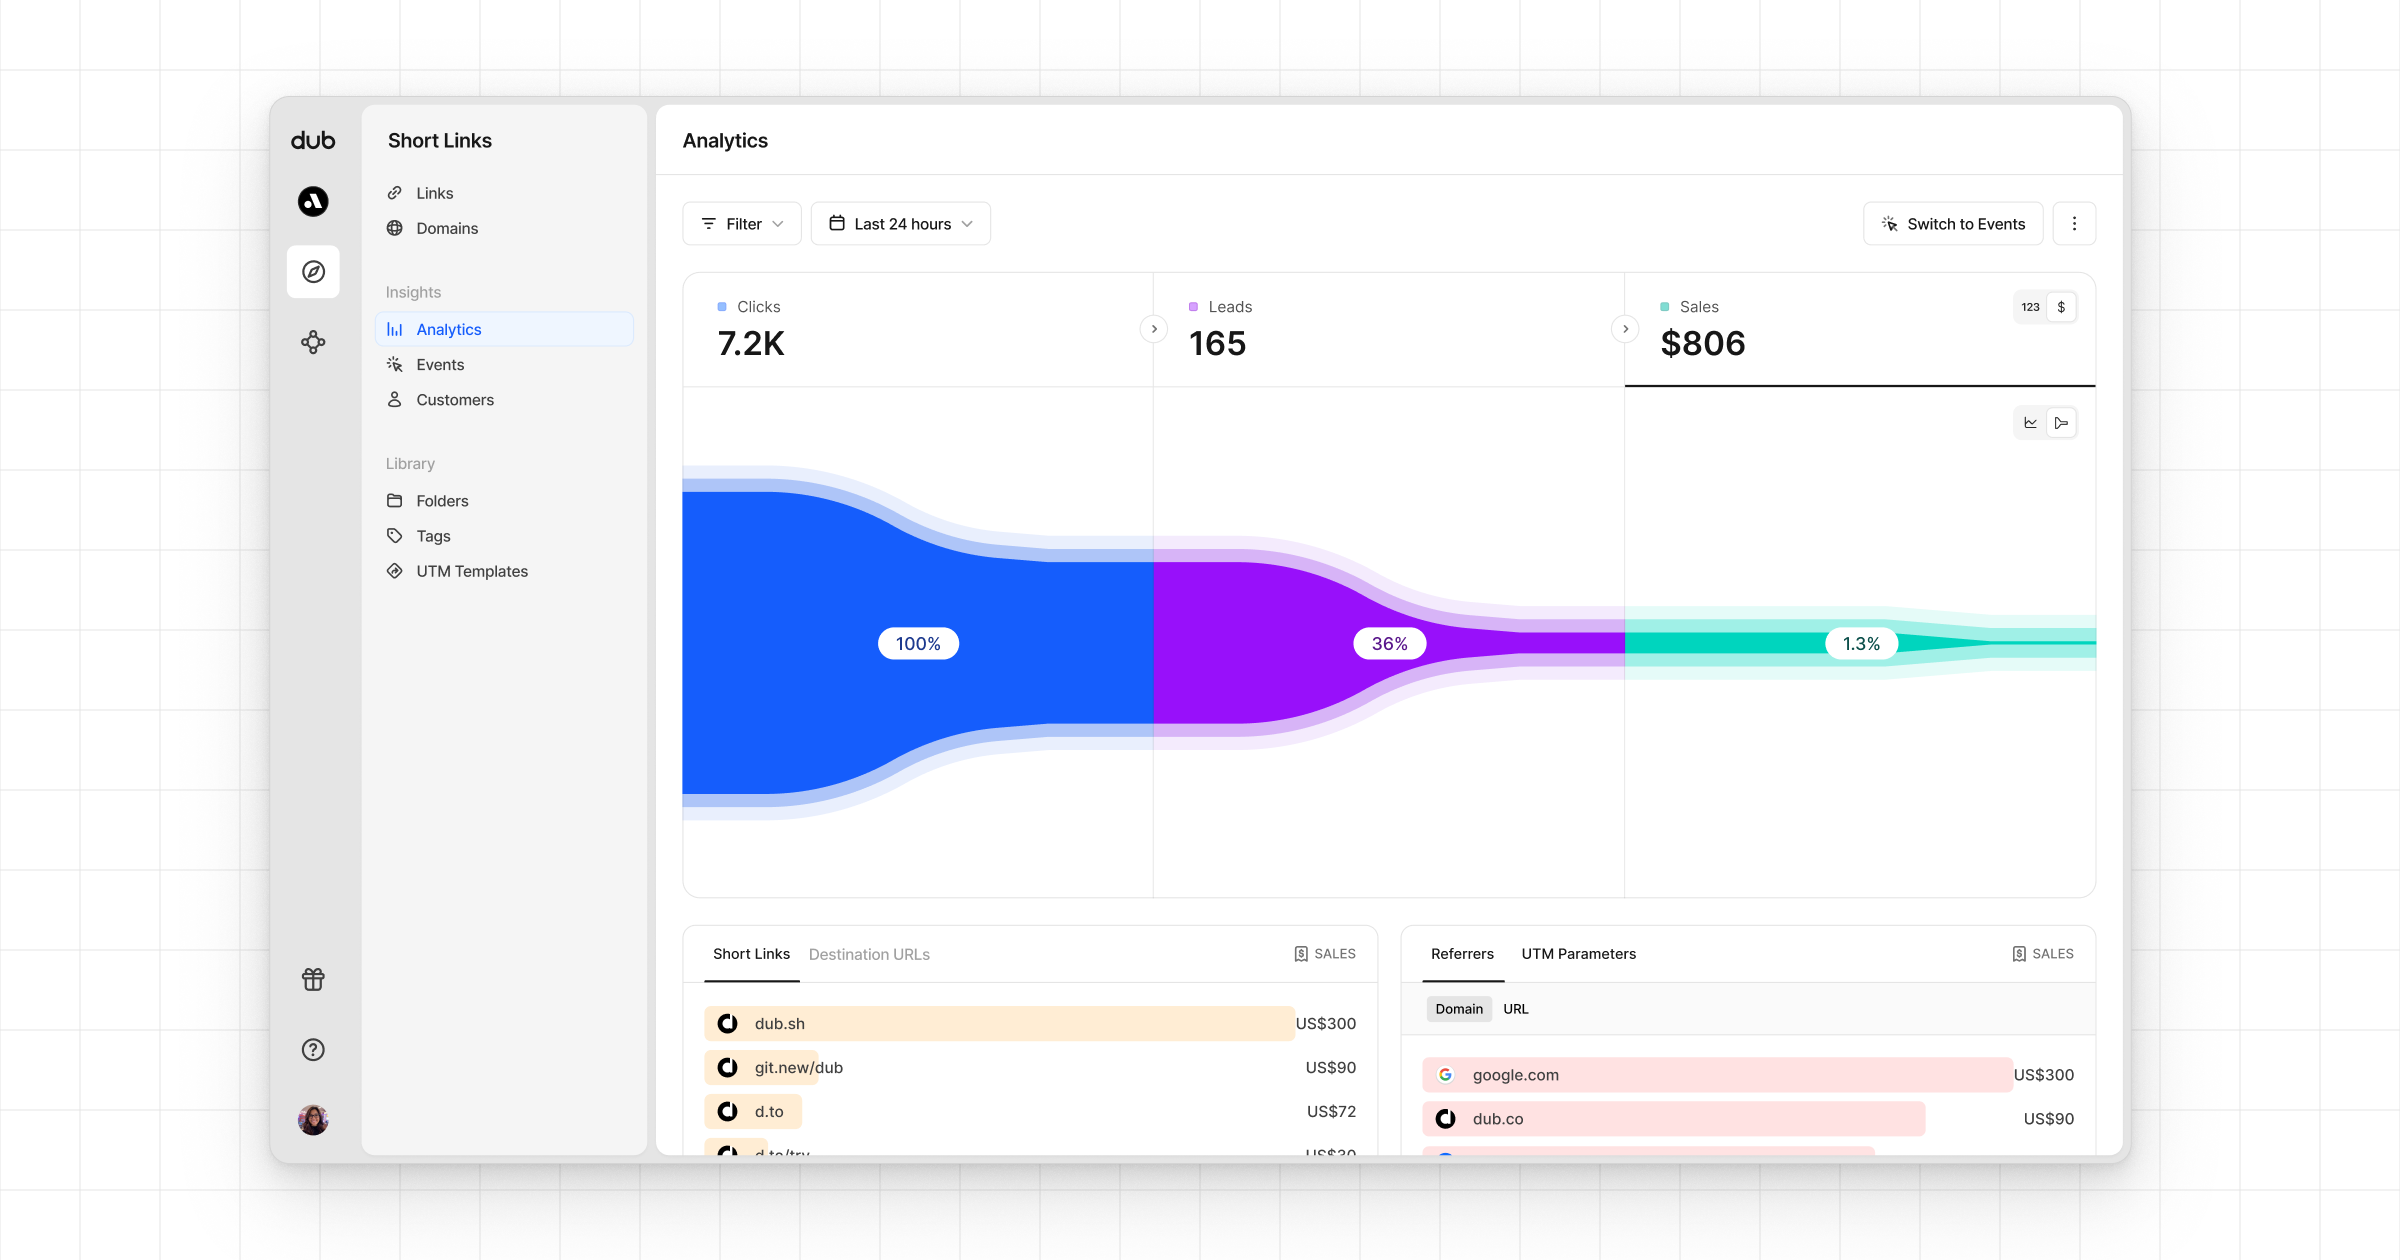
- Funnel chart: A funnel chart view visualizing the conversion & dropoff rates across the different steps in the conversion funnel (clicks → leads → sales).
- Real-time events stream: A real-time events stream of every single conversion event that occurs across all your links in your workspace.
Currency conversion support
For simplicity, Dub records all sales in the default currency of your Dub workspace. This means that if you pass a different currency, it will be automatically converted to USD for reporting consistency – using the latest foreign exchange rates.TypScript
The default currency for all Dub workspaces is currently set to
USD. We will
add the ability to customize that in the future.