On any given day, we track upwards of 1,000,000 click events at Dub.
These events are ingested into our data warehouse, which is then materialized in a comprehensive, real-time analytics dashboard that gives you powerful insights into your user base.
While this is great, it is still an aggregated view of your data. What if you want to see a chronological stream of click events and export them for further analysis?
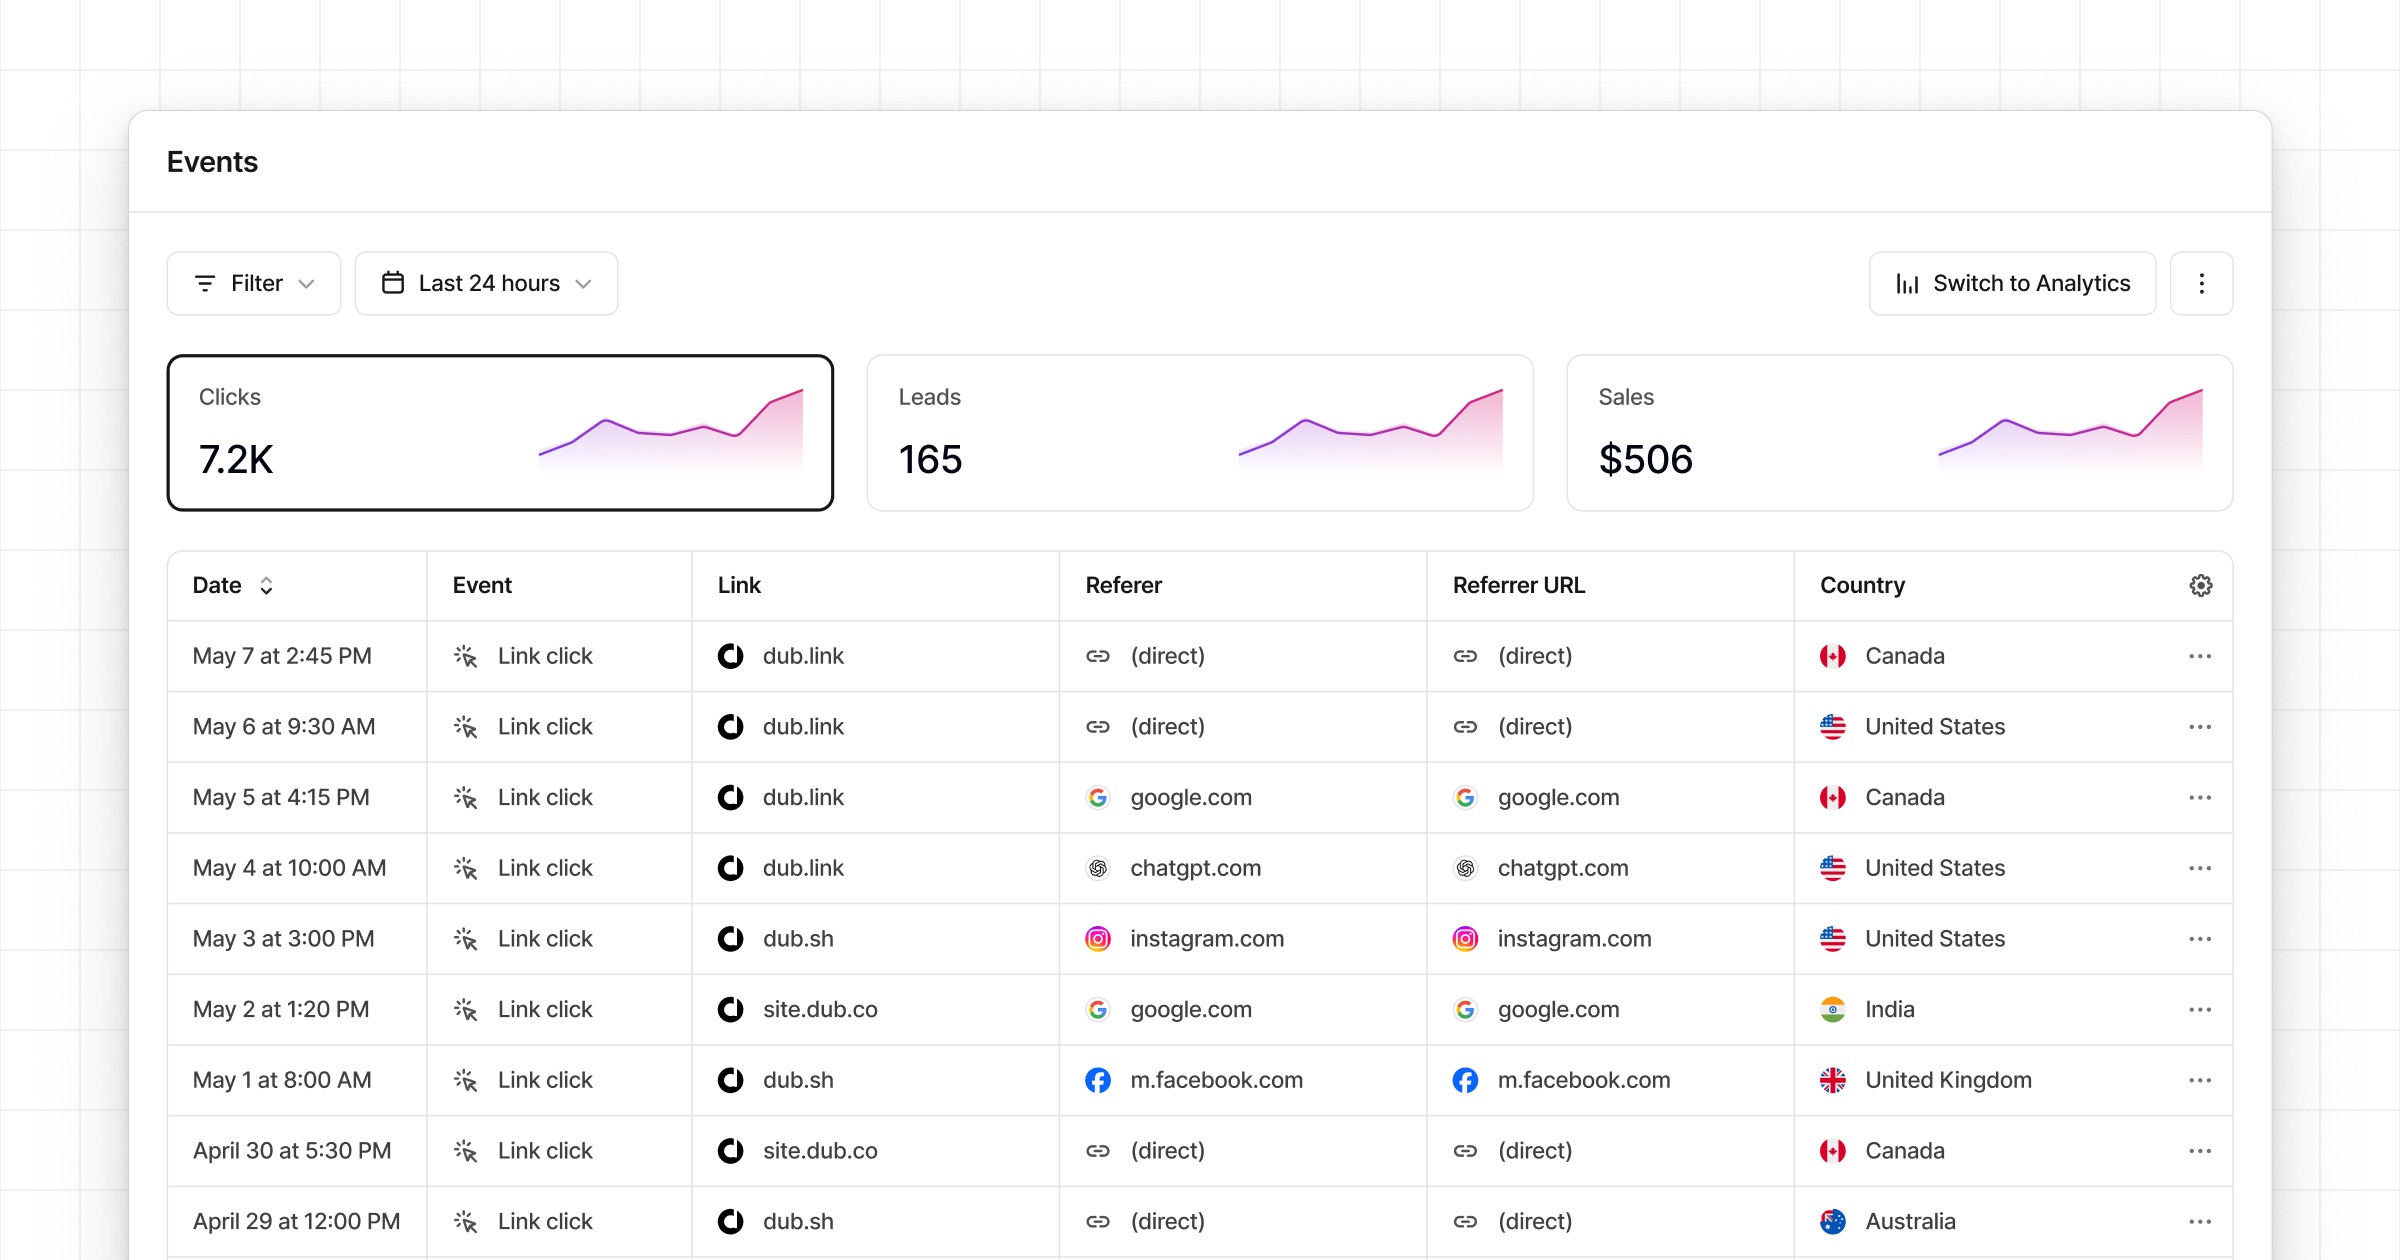
This is where Dub’s Real-time Events Stream feature comes in.
Dub’s Real-time Events Stream is a detailed, real-time stream of events across your entire Dub workspace.
Where can I access it?
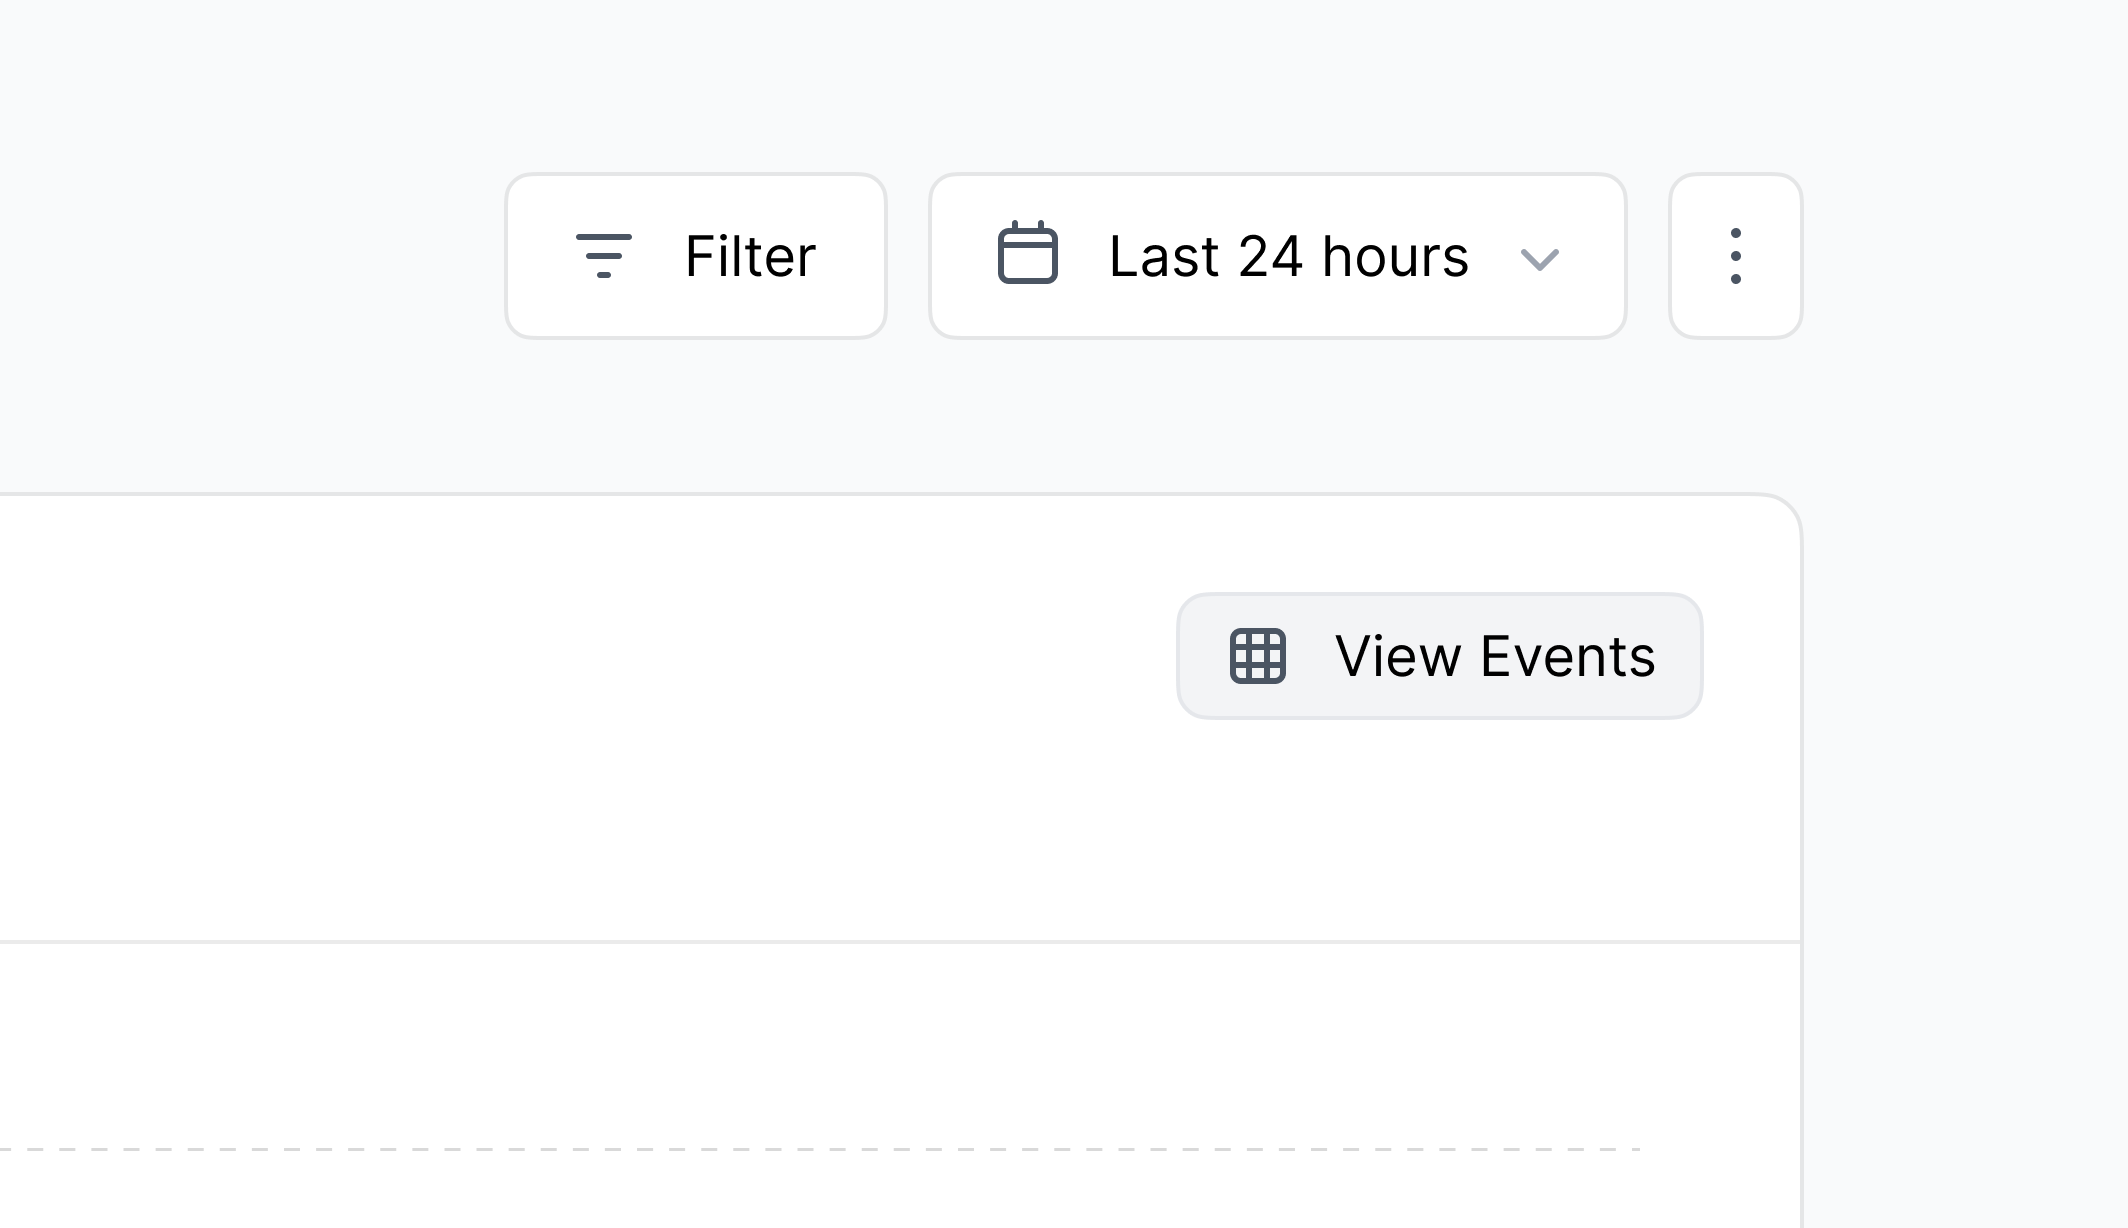
The real-time events stream lives in your workspace’s Events tab, but you can also access it via the View Events button in the Analytics tab:
When you click on the View Events button, the same filters you have
applied in the Analytics tab are applied to the Events tab as well.
Customizing your events table
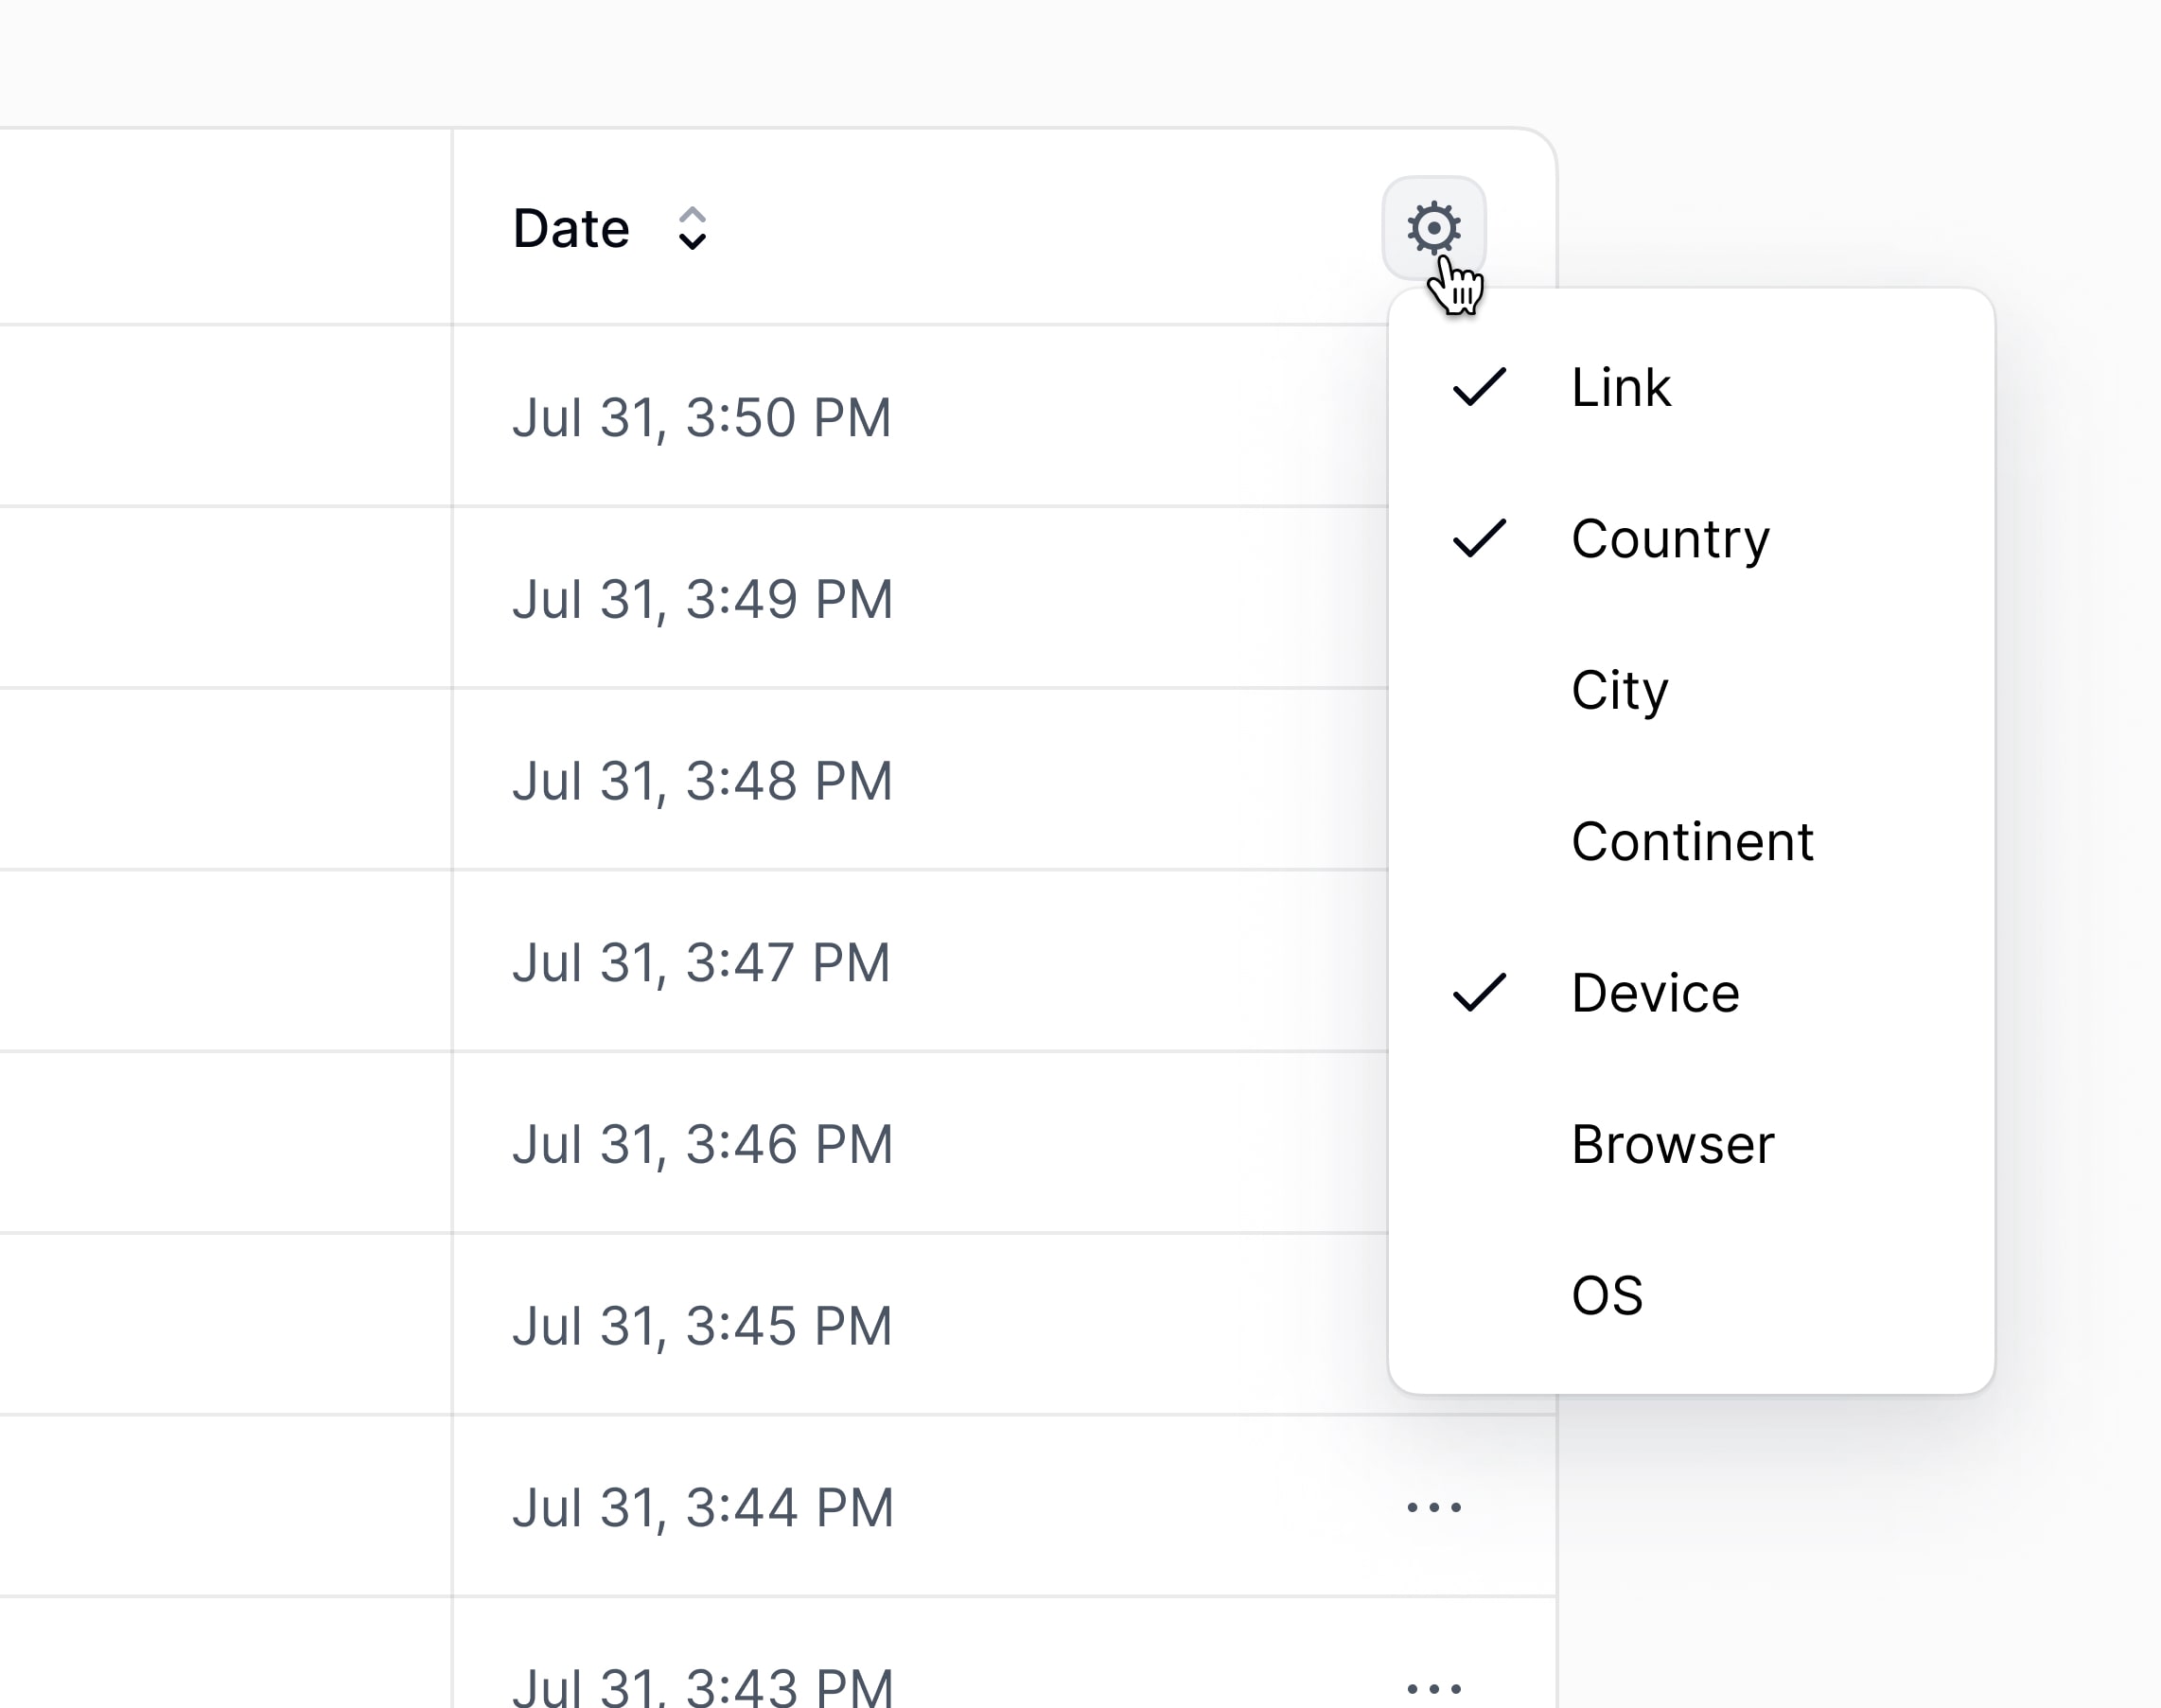
You can also customize the dashboard to only show the columns you are interested in:
Here are the columns you can choose from:
- Link: The link that was clicked/scanned
- Country: The country that the event originated from
- City: The city that the event originated from
- Continent: The continent that the event originated from
- Device: The device that was used to trigger the event
- Browser: The browser that was used to trigger the event
- OS: The operating system that was used to trigger the event
- Referrer: The referrer information for the event
- IP Address: The IP address that the event originated from (non-EU only)
Filtering and exporting events
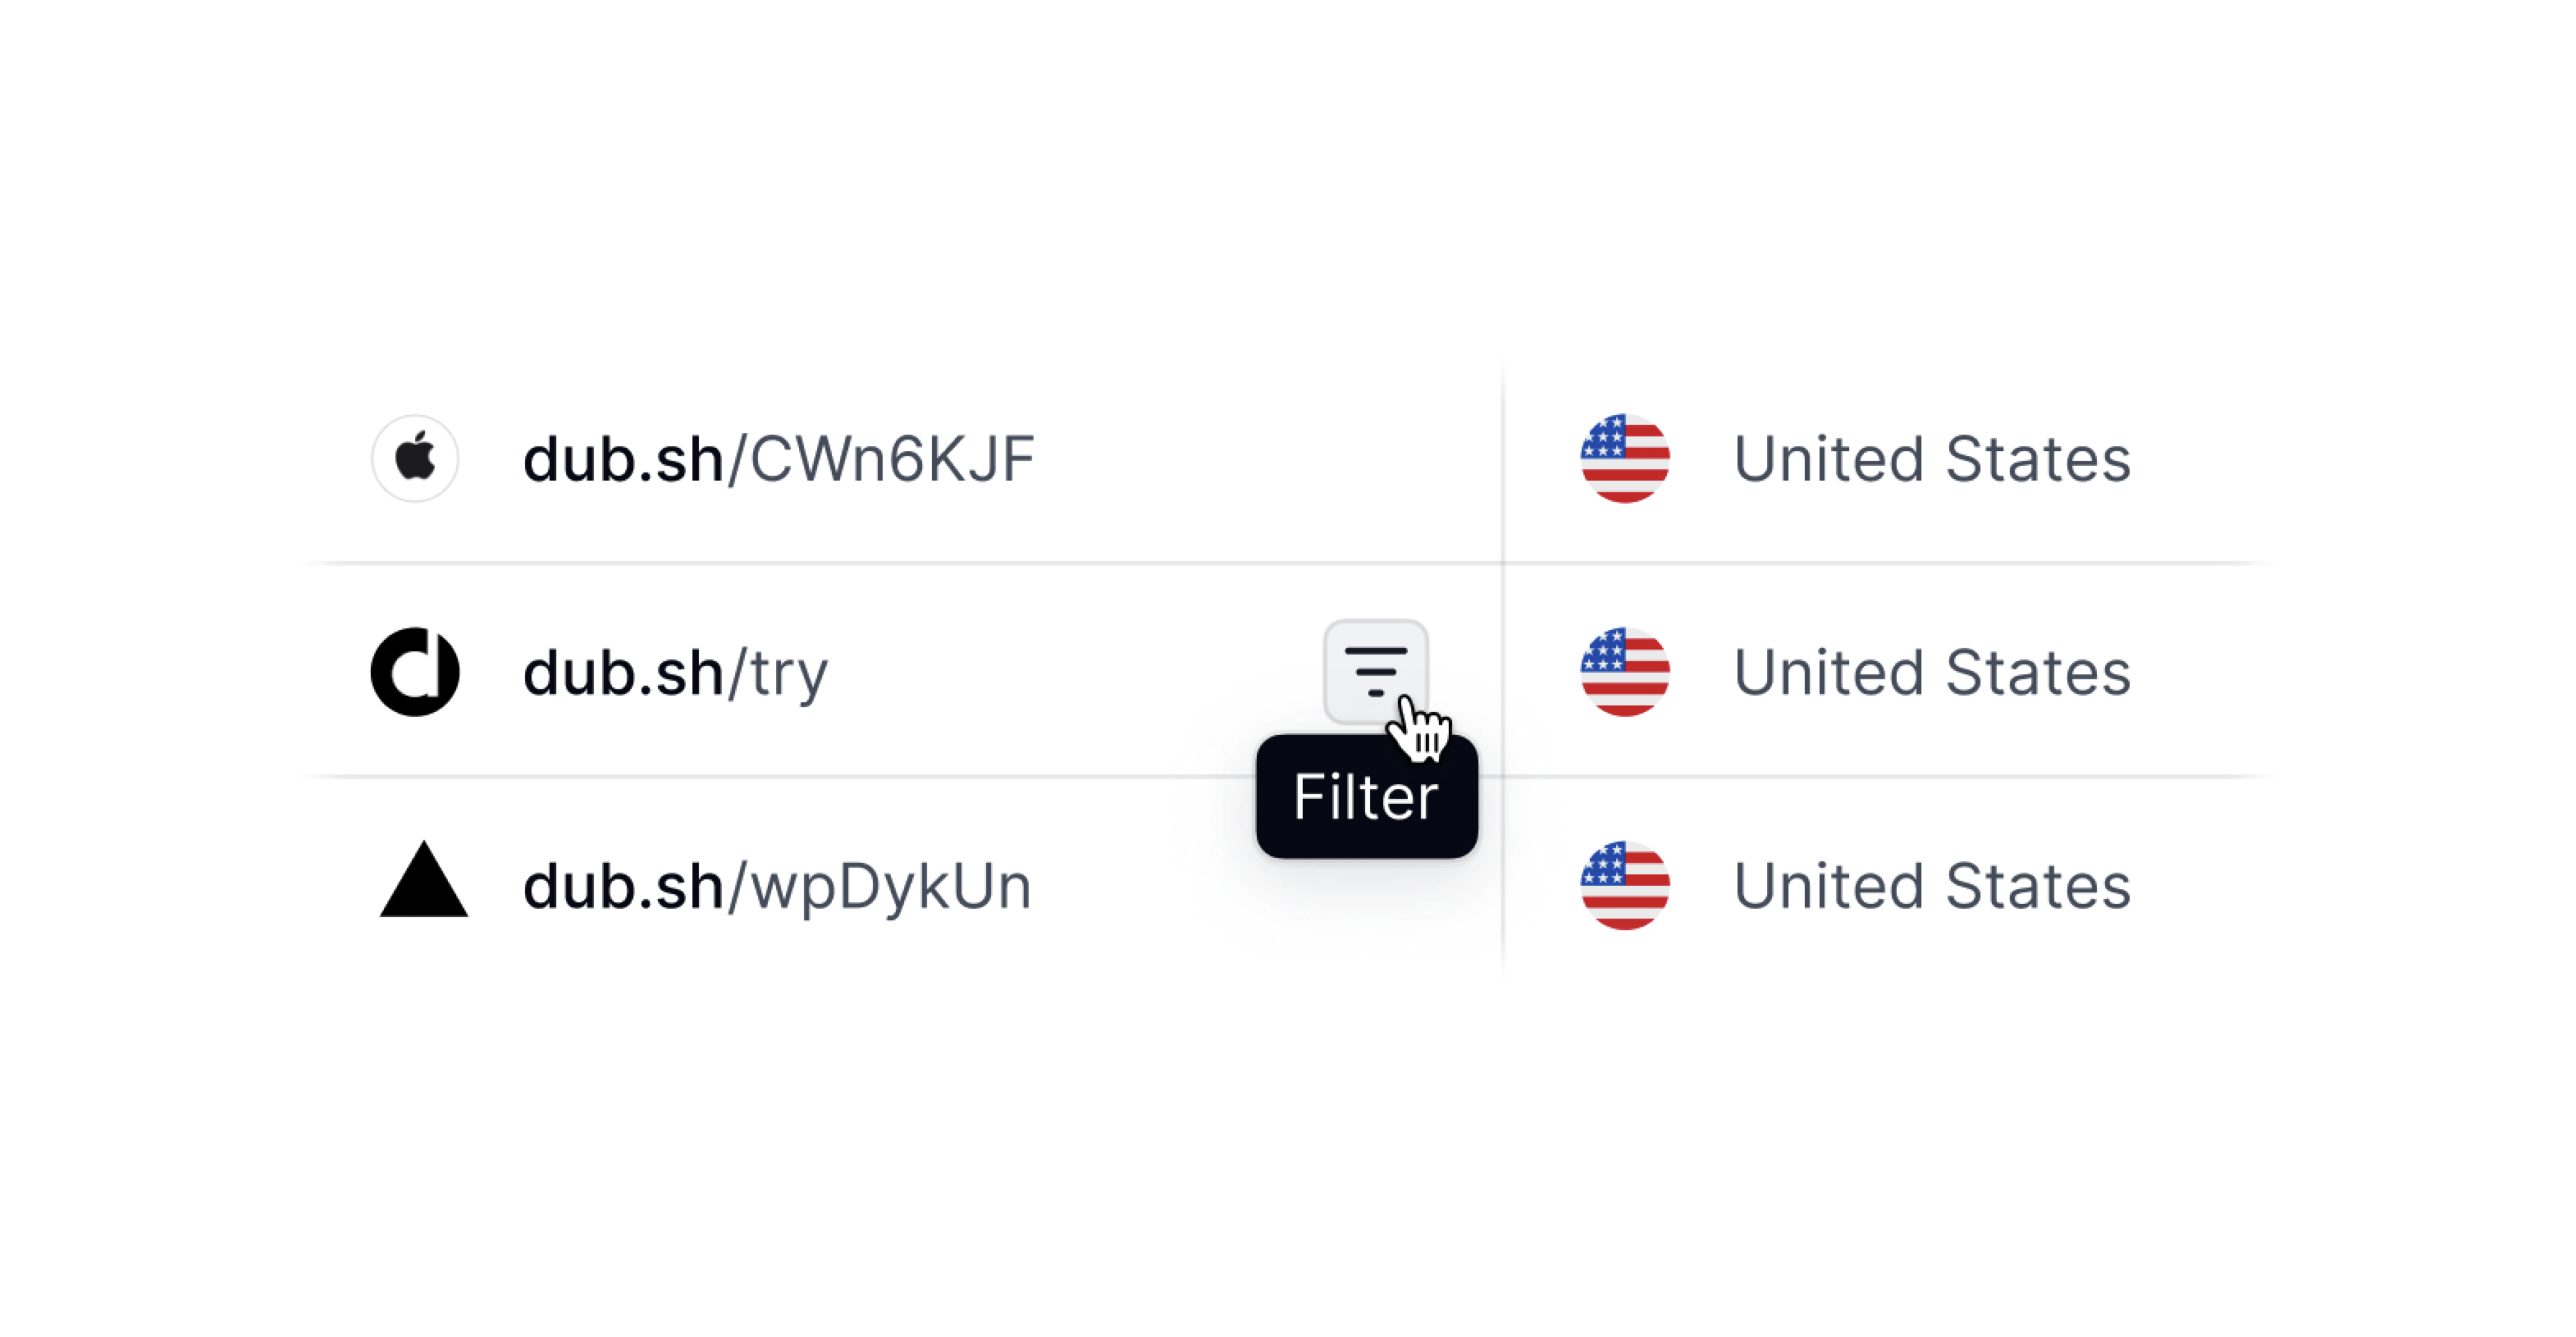
You can also filter the events by the same filter options as the analytics dashboard.
There are two ways you can filter the events stream:
- By clicking on the Filter button in the top right of the dashboard.
- Clicking on the filter icon that appears when you hover over a given column value.
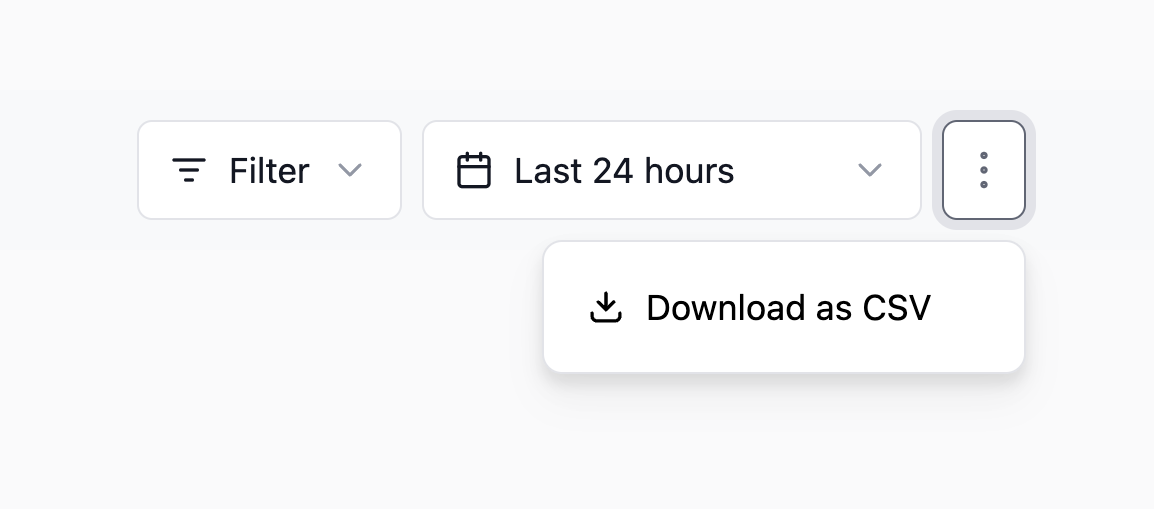
Once you’ve filtered the events to your liking, you can export them by clicking ⋮ button and selecting Download as CSV.