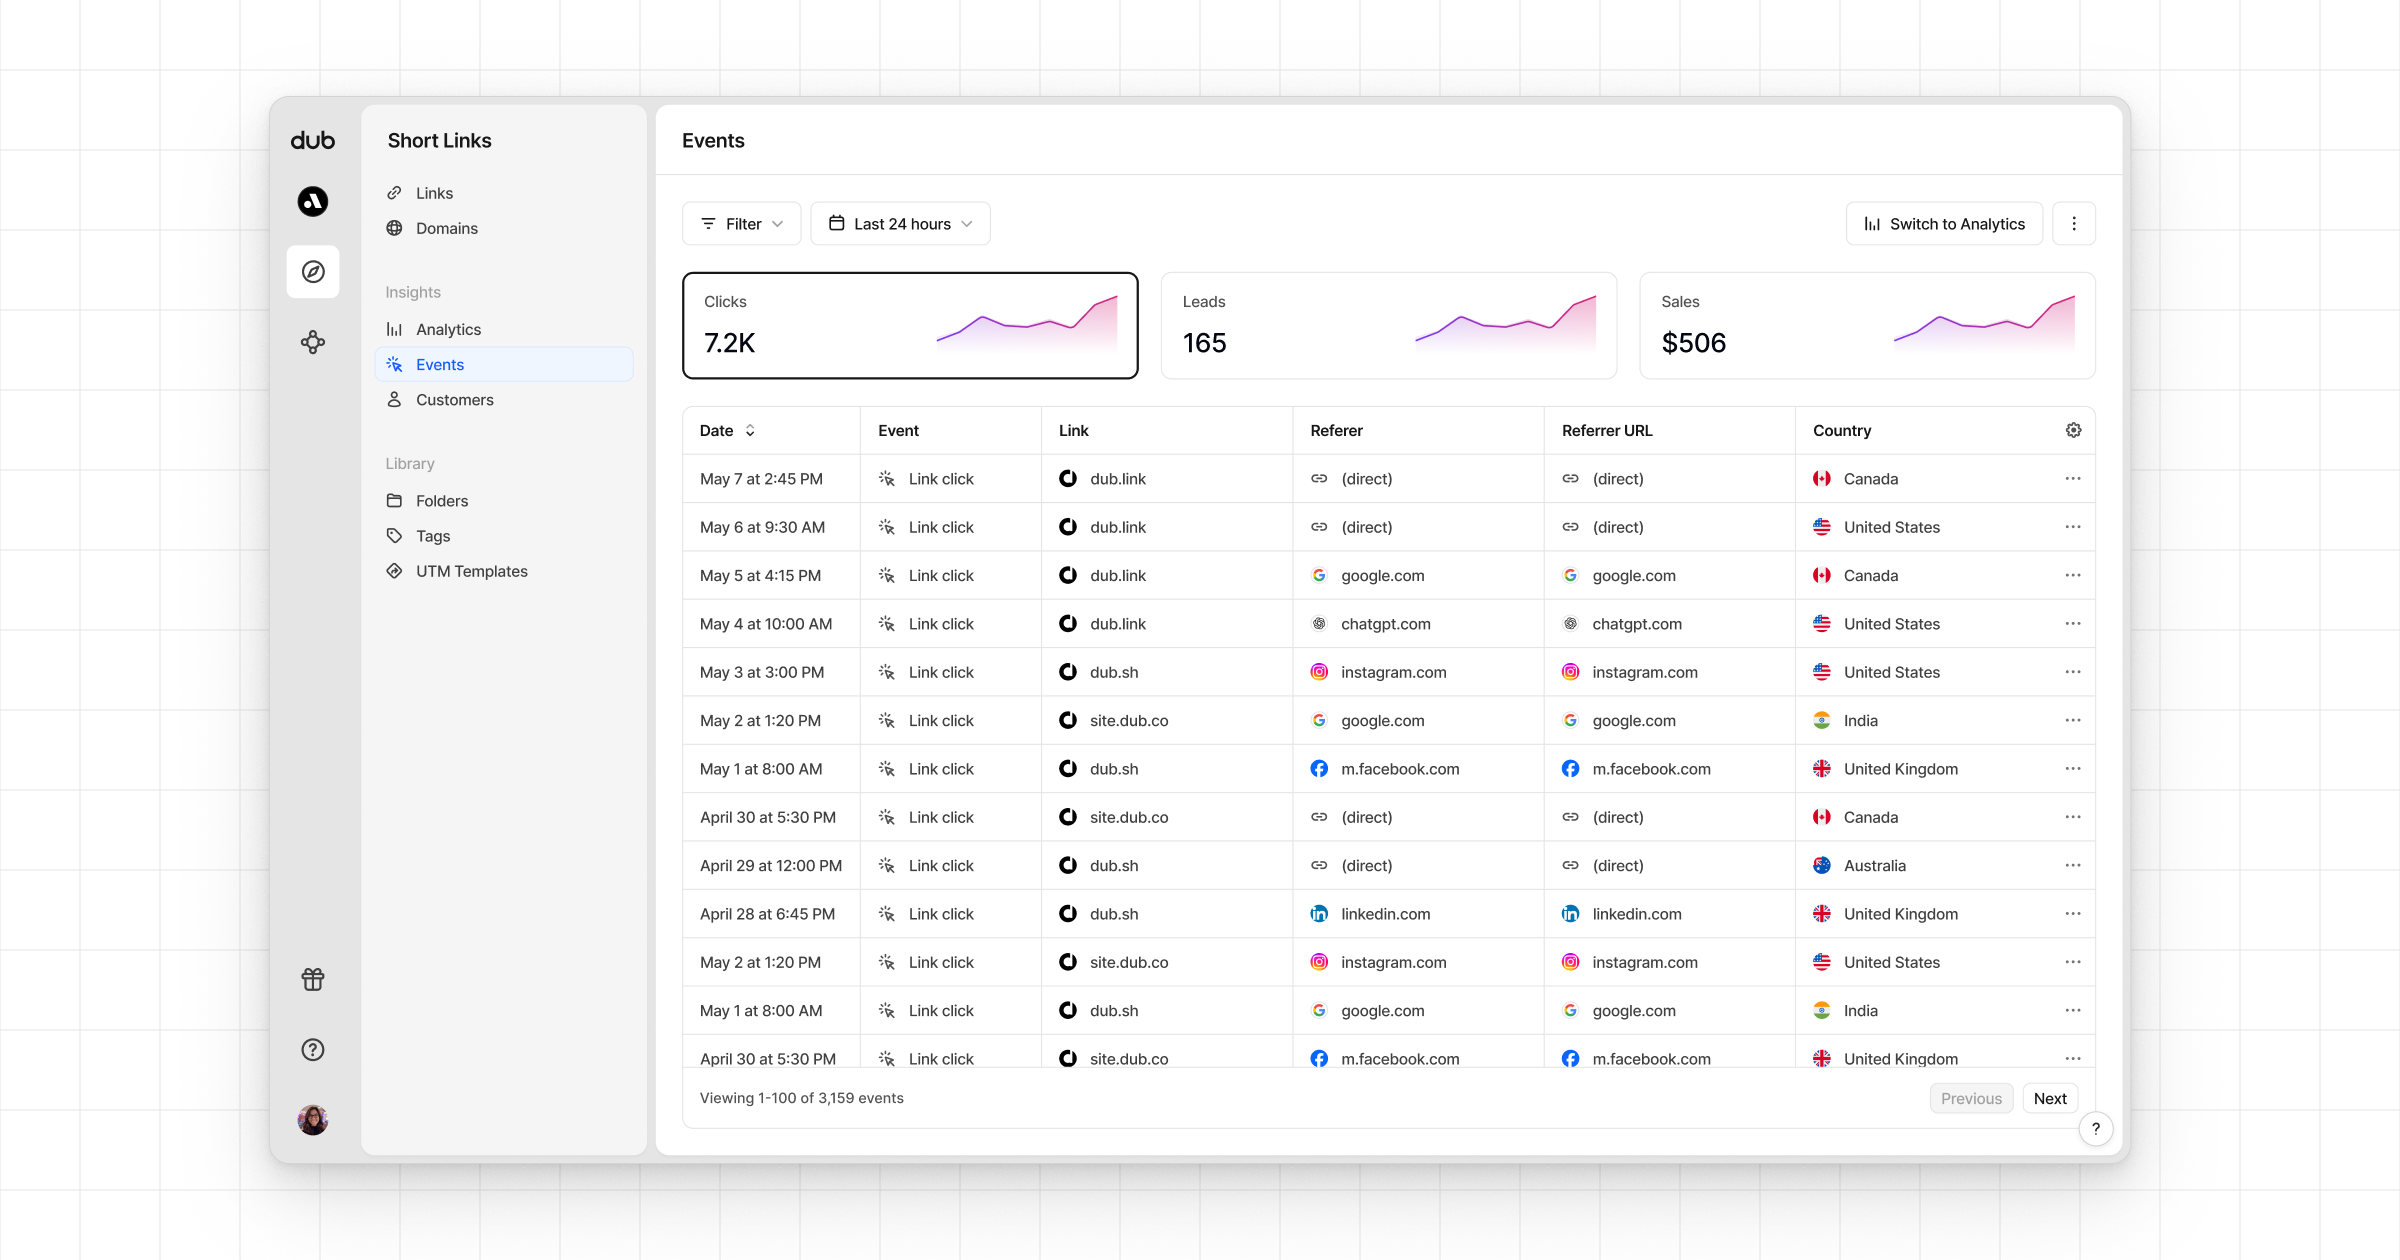
lead event happens when a user performs an action that indicates interest in your product or service. This could be anything from:
- Signing up for an account
- Booking a demo meeting
- Joining a mailing list

Prerequisites
First, you’ll need to enable conversion tracking for your Dub links to be able to start tracking conversions:Option 1: On a workspace-level
Option 1: On a workspace-level
To enable conversion tracking for all future links in a workspace, you can do the following:
To enable conversion tracking for all future links in a workspace, you can do the following: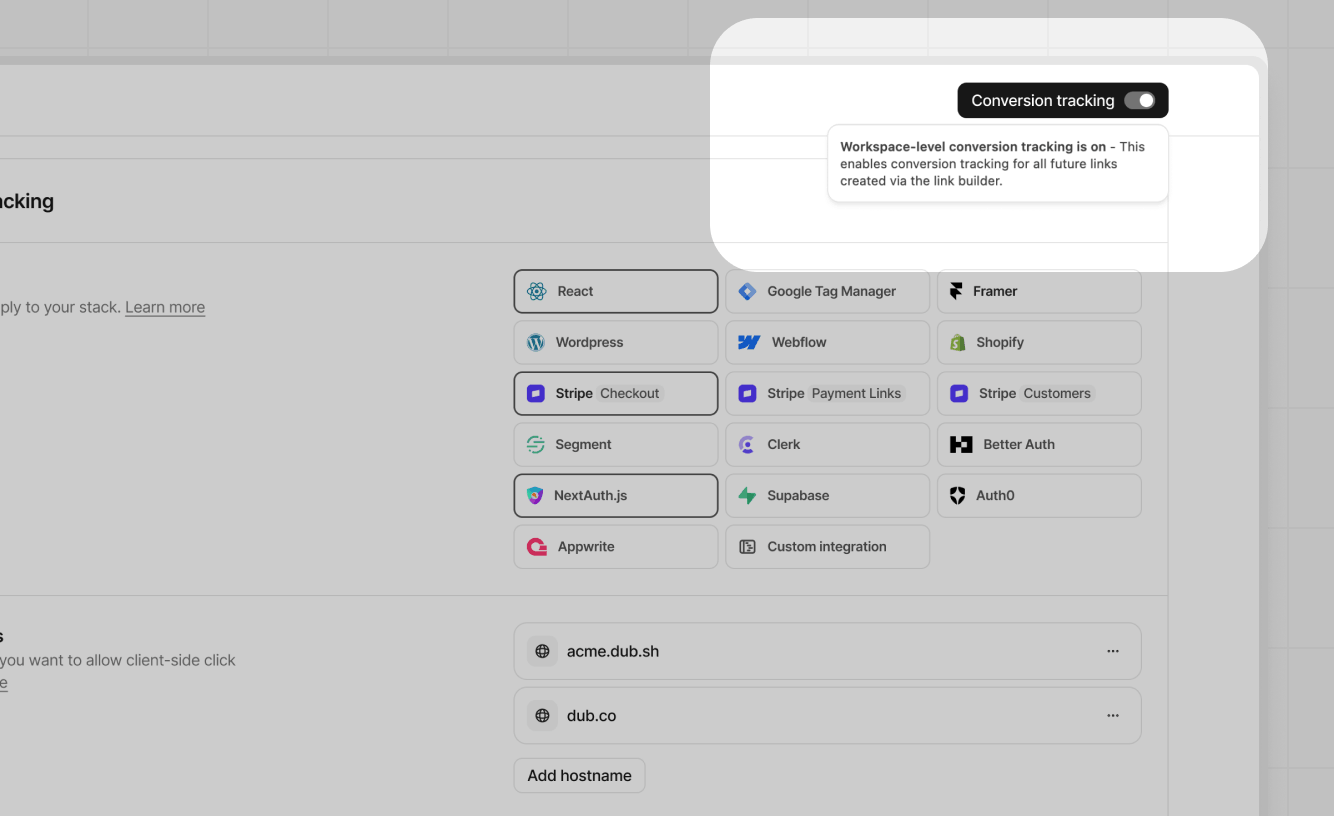
- Navigate to your workspace’s Tracking settings page.
- Toggle the Workspace-level Conversion Tracking switch to enable conversion tracking for the workspace.
Option 2: On a link-level
Option 2: On a link-level
If you don’t want to enable conversion tracking for all your links in a workspace, you can also opt to enable it on a link-level.To enable conversion tracking for a specific link, open the Dub Link Builder for a link and toggle the Conversion Tracking switch.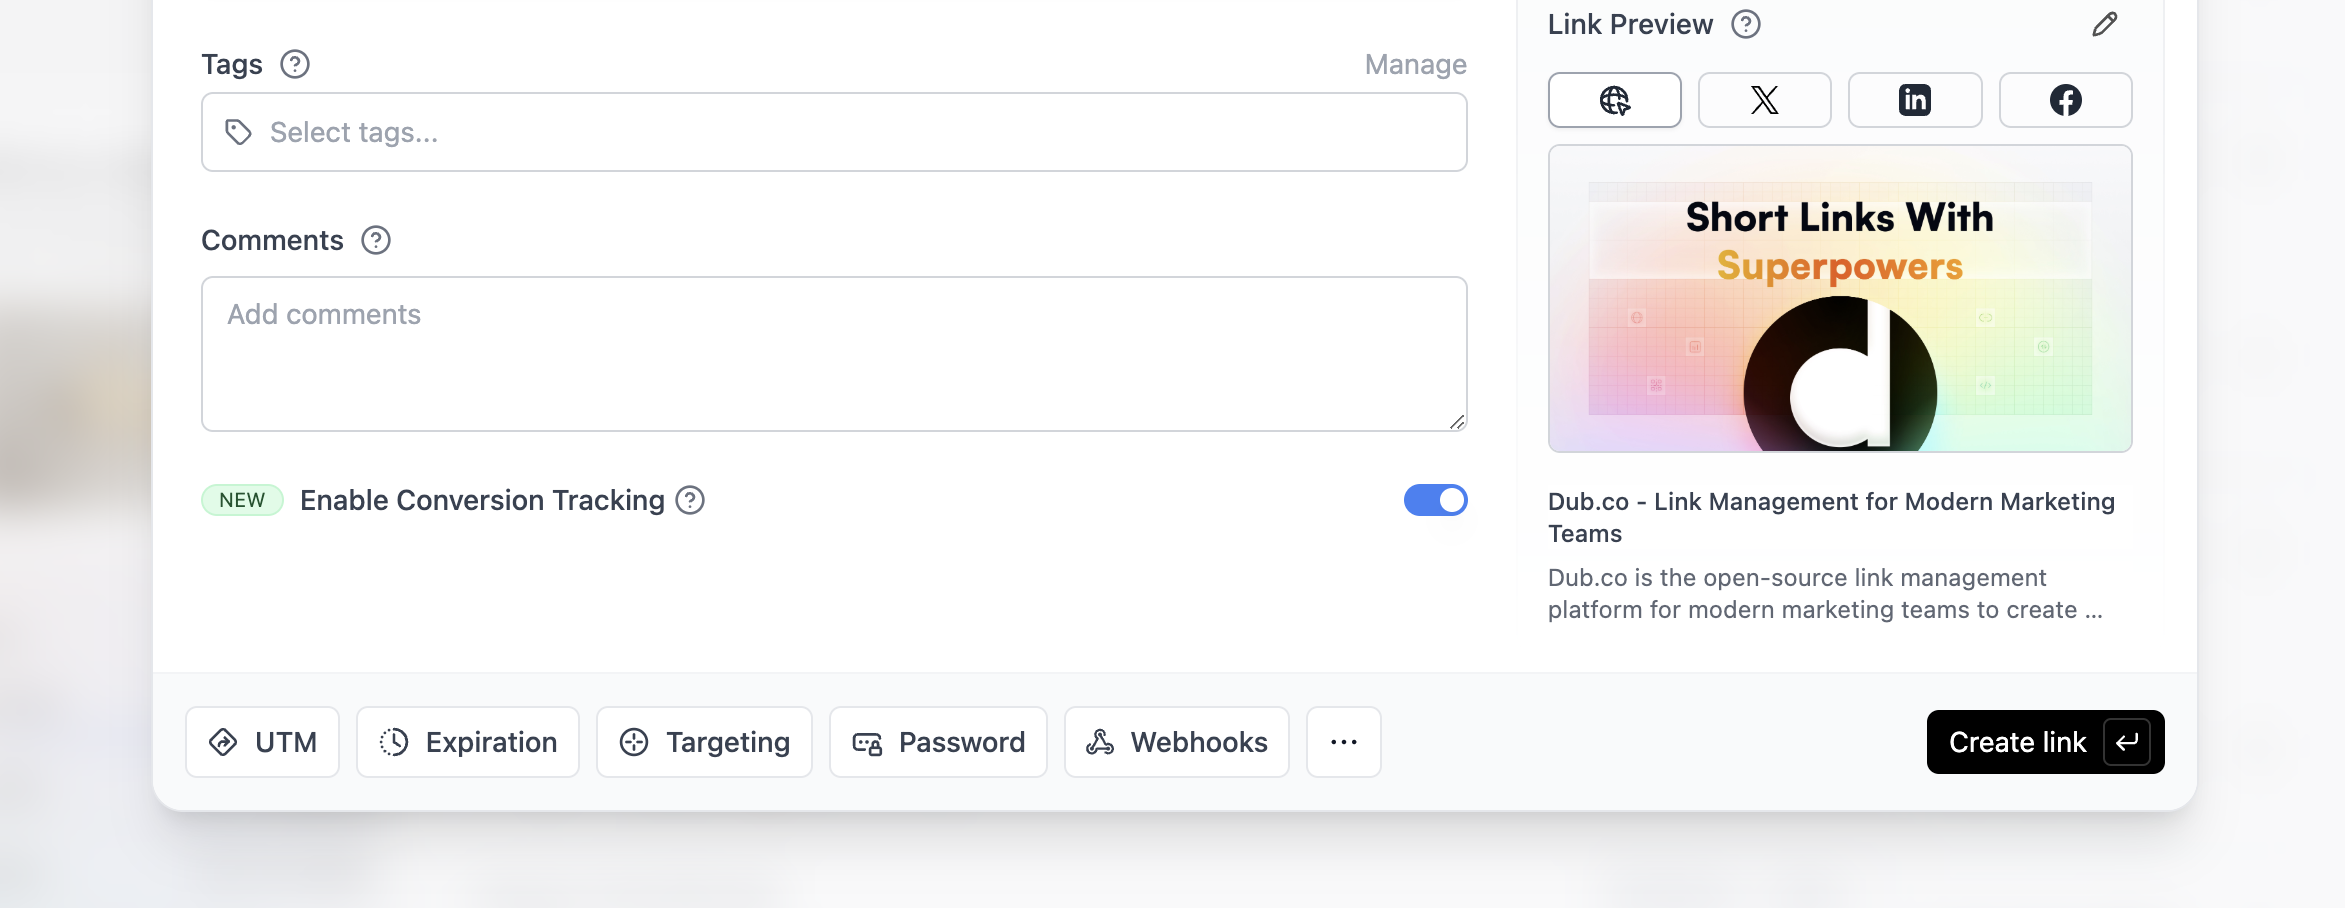
Option 3: Via the API
Option 3: Via the API
Alternatively, you can also enable conversion tracking programmatically via the Dub API. All you need to do is pass
trackConversion: true when creating or updating a link:React
Manual installation
Framer
Shopify
WordPress
Webflow
Google Tag Manager
You can verify the installation with the following tests:
- Open the browser console and type in
_dubAnalytics– if the script is installed correctly, you should see the_dubAnalyticsobject in the console. - Add the
?dub_id=testquery parameter to your website URL and make sure that thedub_idcookie is being set in your browser.
- The analytics script was added to the
<head>section of the page - If you’re using a content delivery network (CDN), make sure to purge any cached content
Configure Appwrite
Next, configure Appwrite to track lead conversion events during the sign up process.1
Create an Appwrite Cloud project
Head to Appwrite Cloud and create a new project.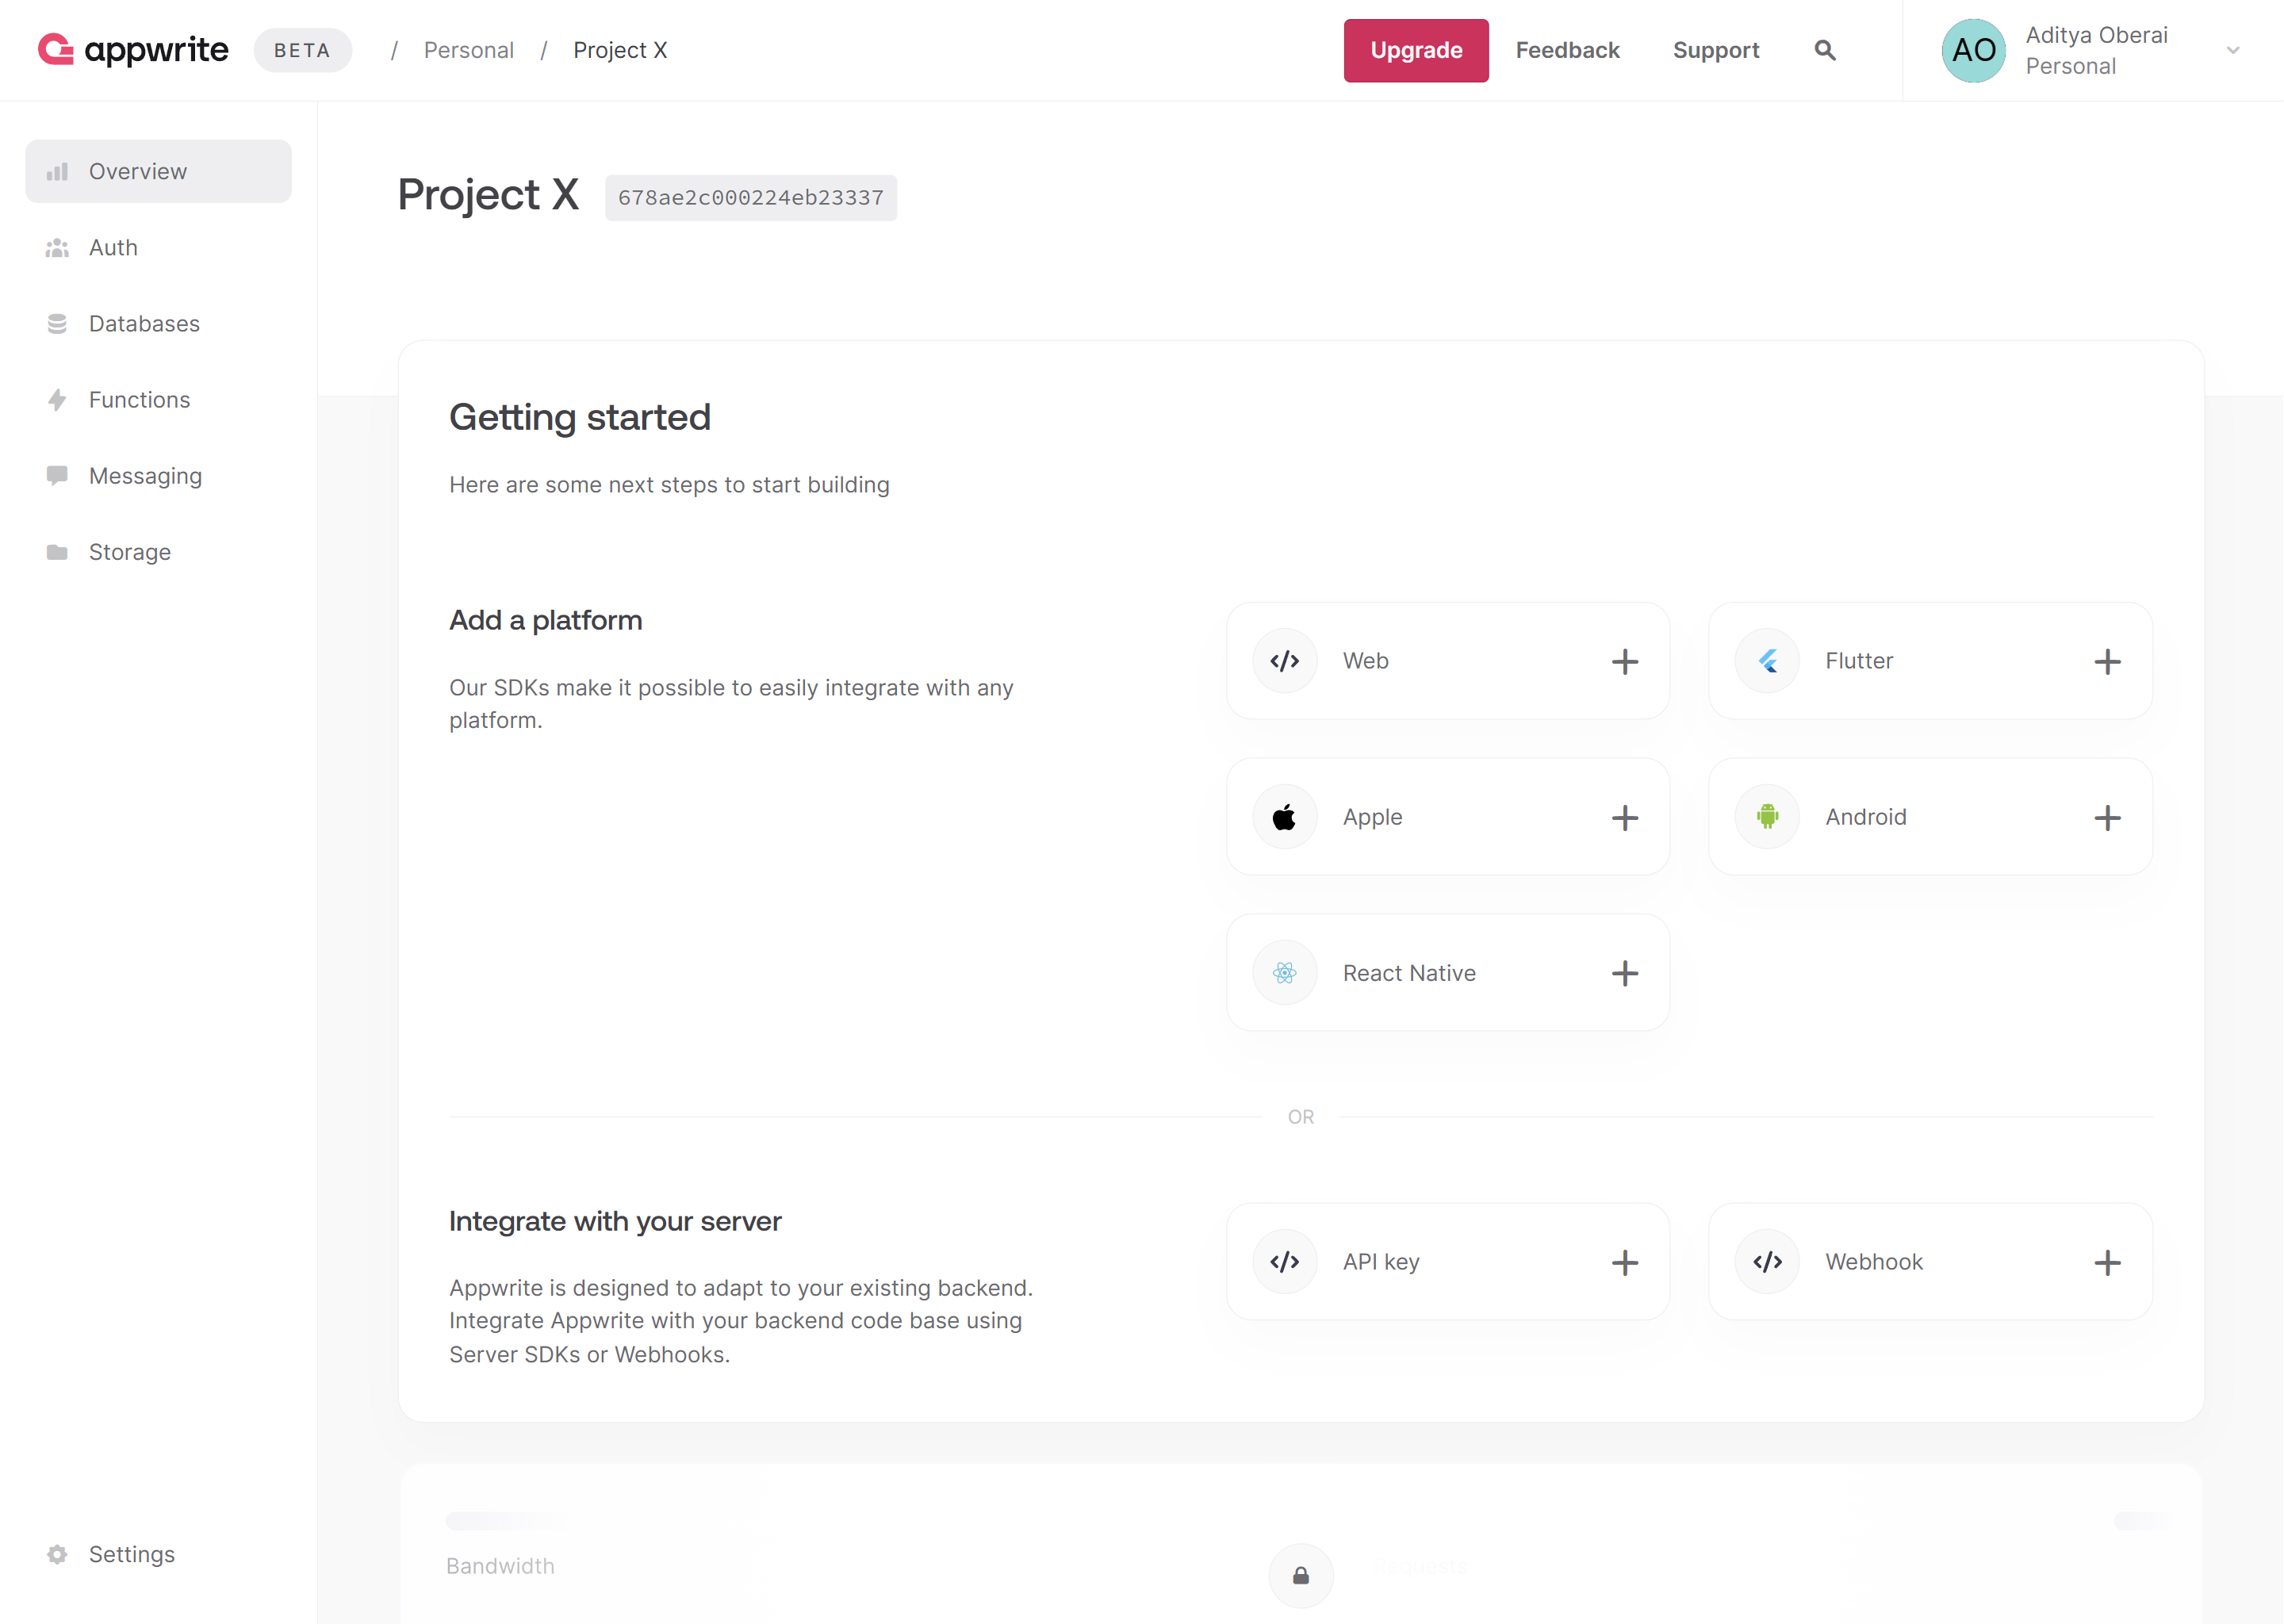
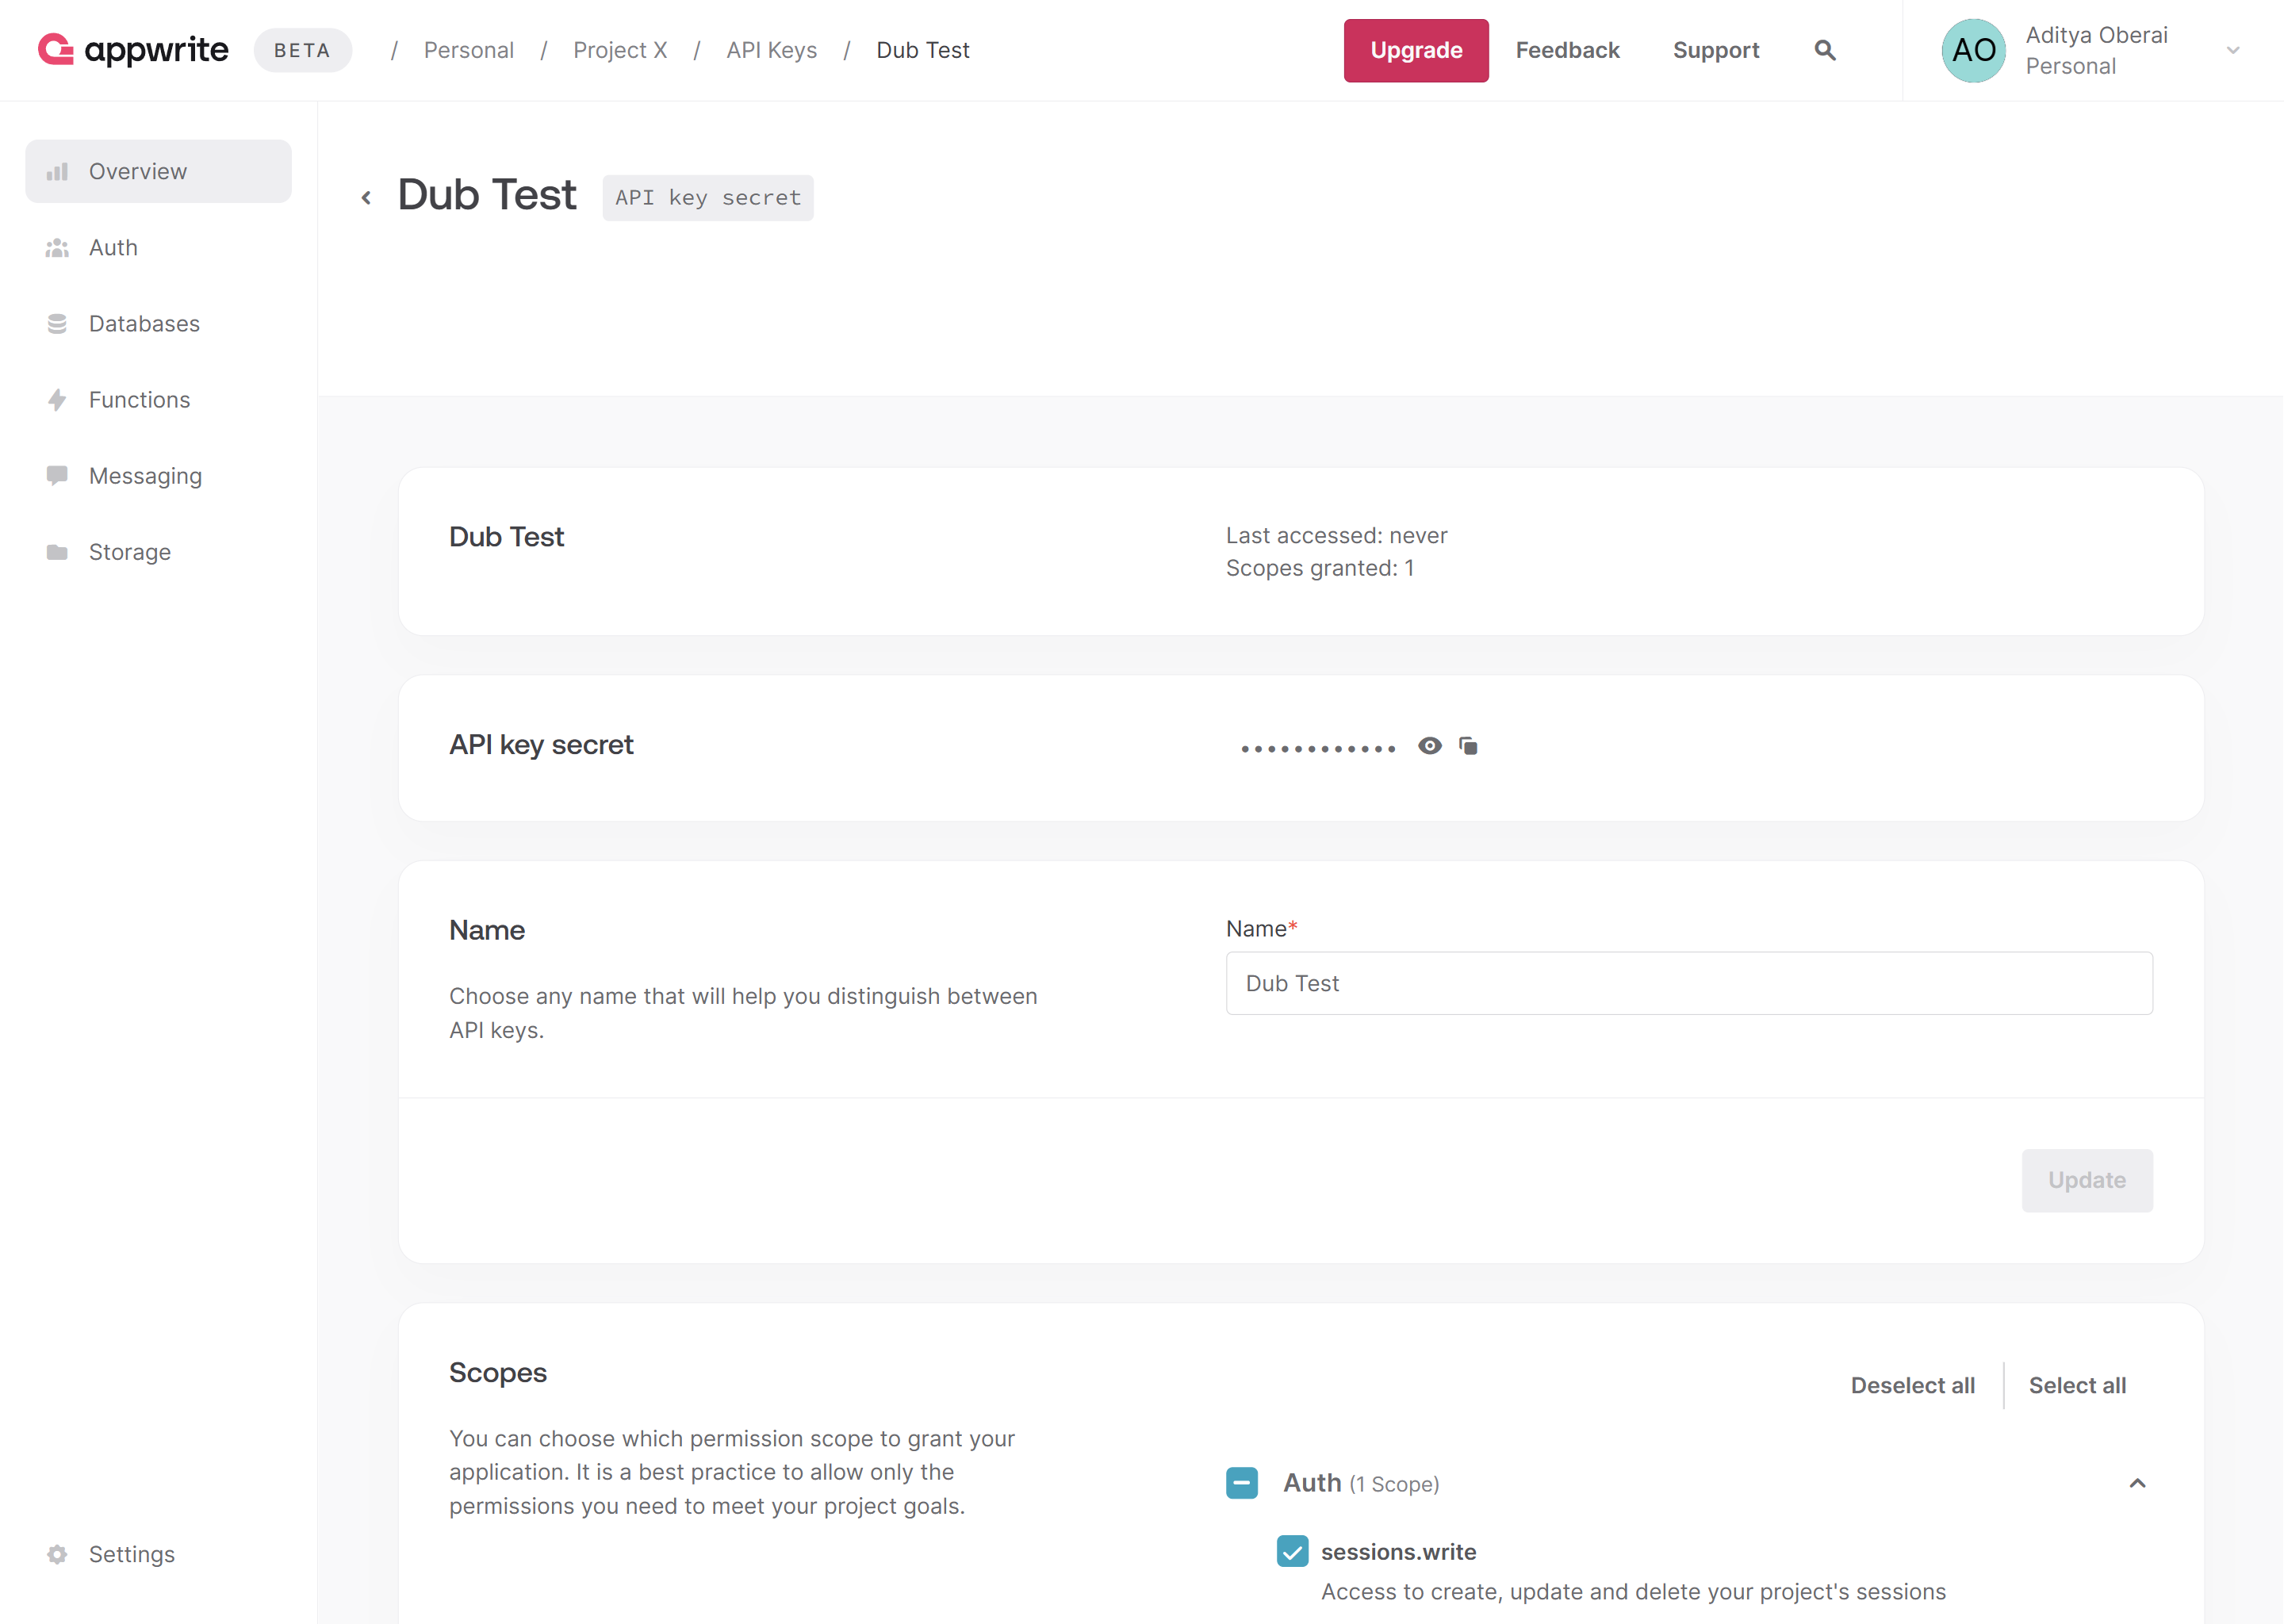
sessions.write scope enabled and save the API key for later use. You can also copy your project ID and endpoint from the project’s Settings page.2
Add environment variables
Add the following environment variables to your app.
3
Integrate Dub Analytics
Add the
DubAnalytics component from the @dub/analytics package to your app’s root layout.src/app/layout.tsx
4
Prepare the Appwrite client and auth library
Create the Appwrite Session and Admin client (necessary for SSR apps, as explained in the Appwrite docs). Additionally, create a function to verify user login.
src/lib/server/appwrite.ts
5
Set up Dub SDK
Create the Dub client and send leads to Dub using the
dub.track.lead() function.src/lib/server/dub.ts
6
Send leads to Dub on user signup
In the
/auth page, use the Appwrite Admin client to allow users to sign up. Post sign up, check if the dub_id cookie is present, send a lead event to Dub if found, and delete the dub_id cookie.src/app/auth/page.tsx
Example App
To learn more about how to track leads with Appwrite, check out the following example app:Appwrite + Dub Next.js Example
See how to track new user sign-ups with Appwrite and the Dub SDK.
View your conversions
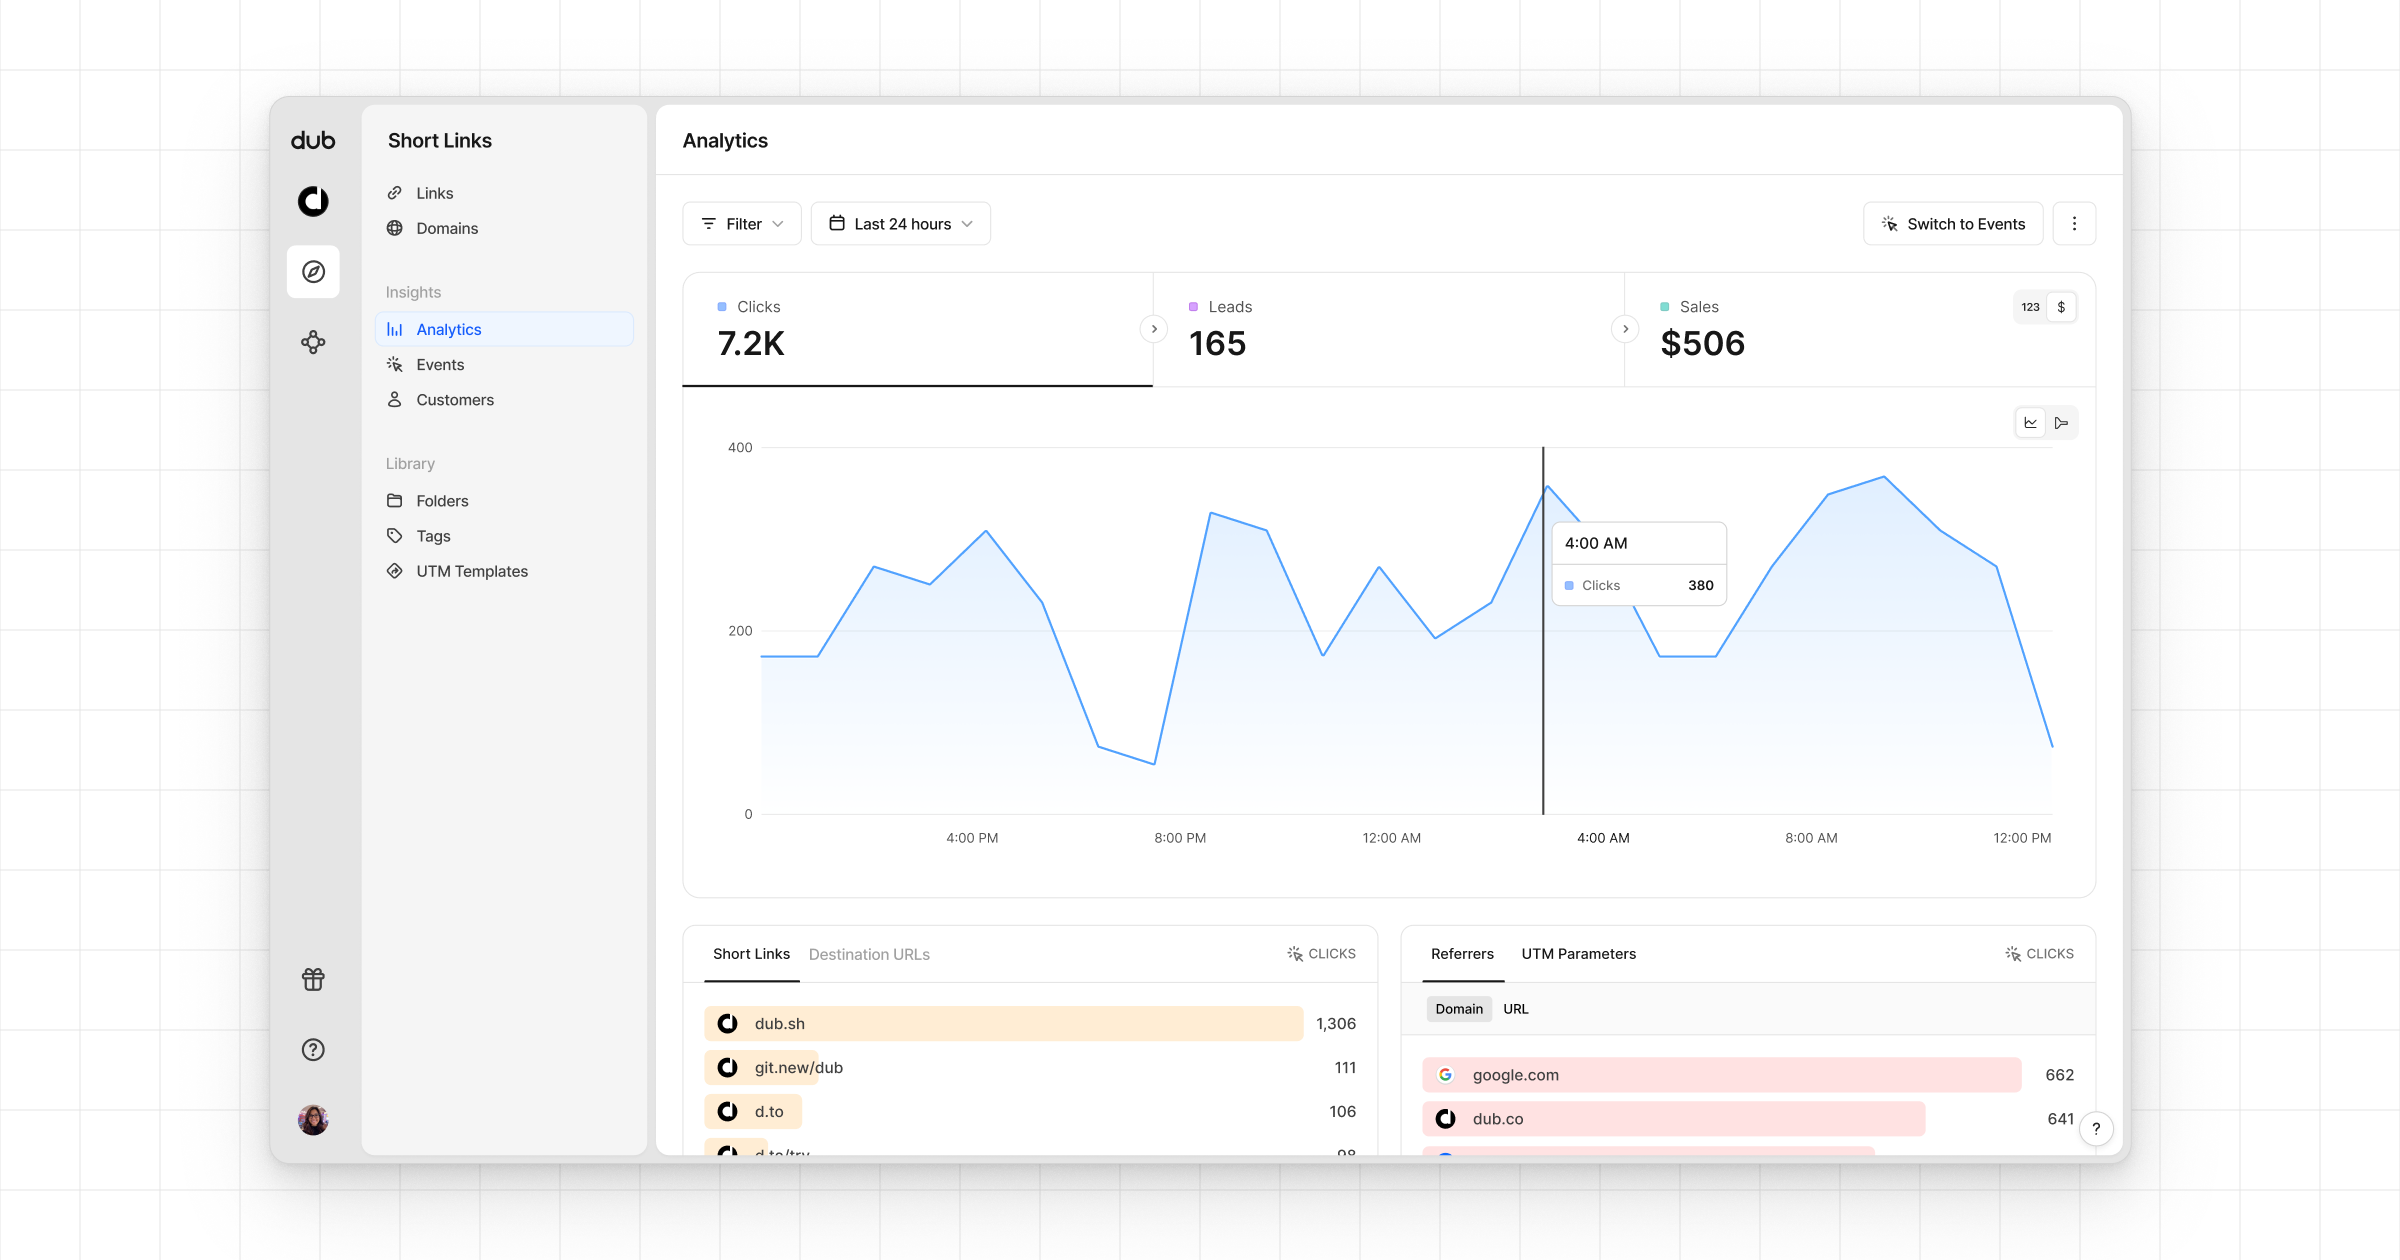
Once you’ve completed the setup, all your tracked conversions will show up in Dub Analytics. We provide 3 different views to help you understand your conversions:- Time-series: A time-series view of the number clicks, leads and sales.
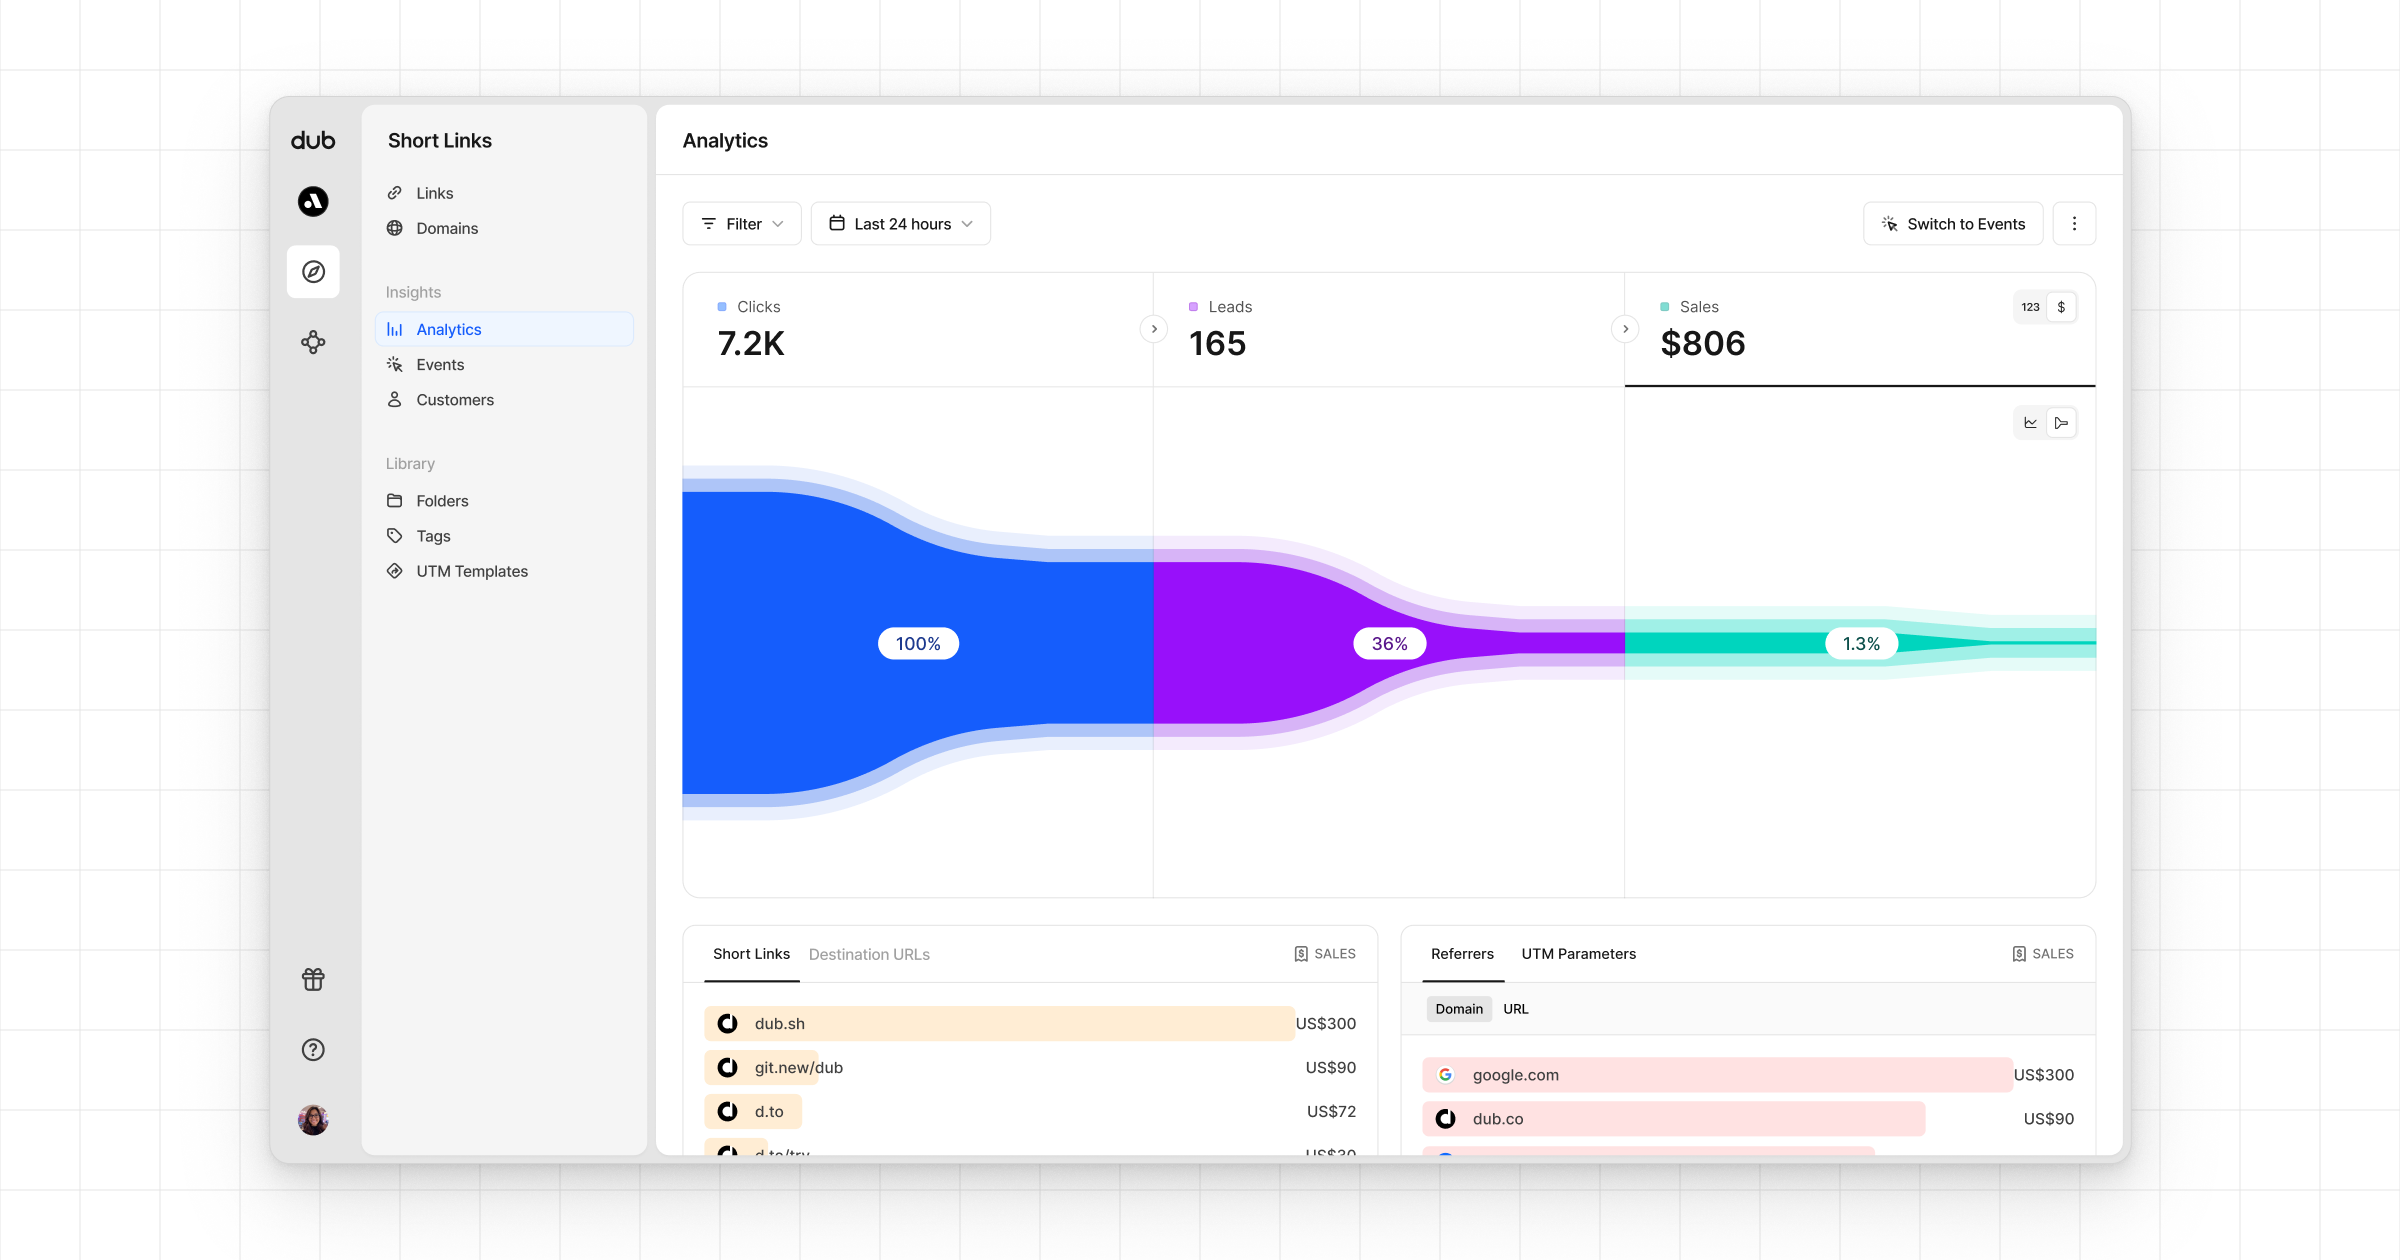
- Funnel chart: A funnel chart view visualizing the conversion & dropoff rates across the different steps in the conversion funnel (clicks → leads → sales).
- Real-time events stream: A real-time events stream of every single conversion event that occurs across all your links in your workspace.