

Where to find commission analytics?
When viewing your Partner Program navigation, click on the Analytics page in the Insights group. In the analytics chart, select Commissions from the top data selector.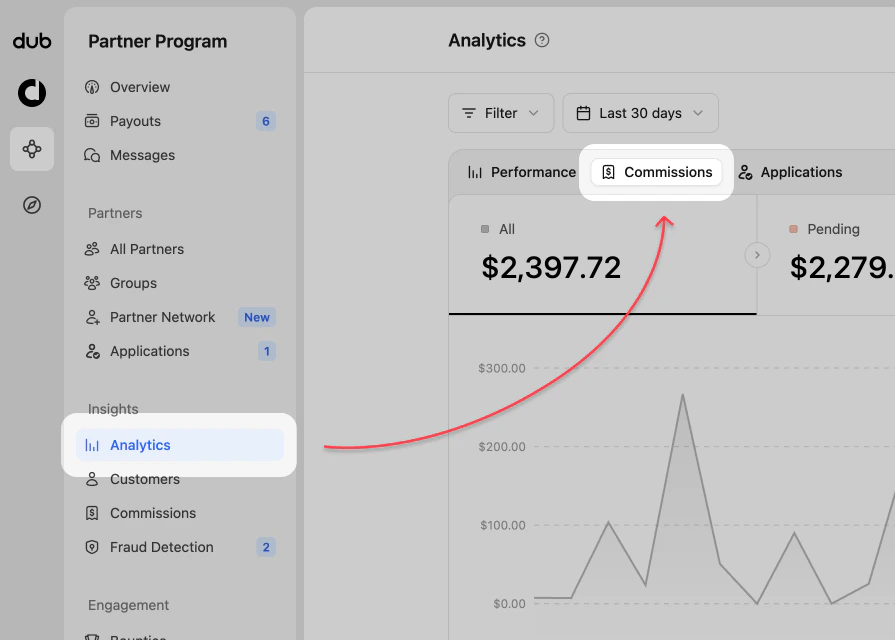
Commission analytics views
The commission analytics dashboard uses filtering and date range controls like the program analytics, but focuses the chart on commission earnings.1. Commission chart
The commission chart shows commission earnings across the selected date range. You can use it to identify spikes, dips, and trends in partner payouts.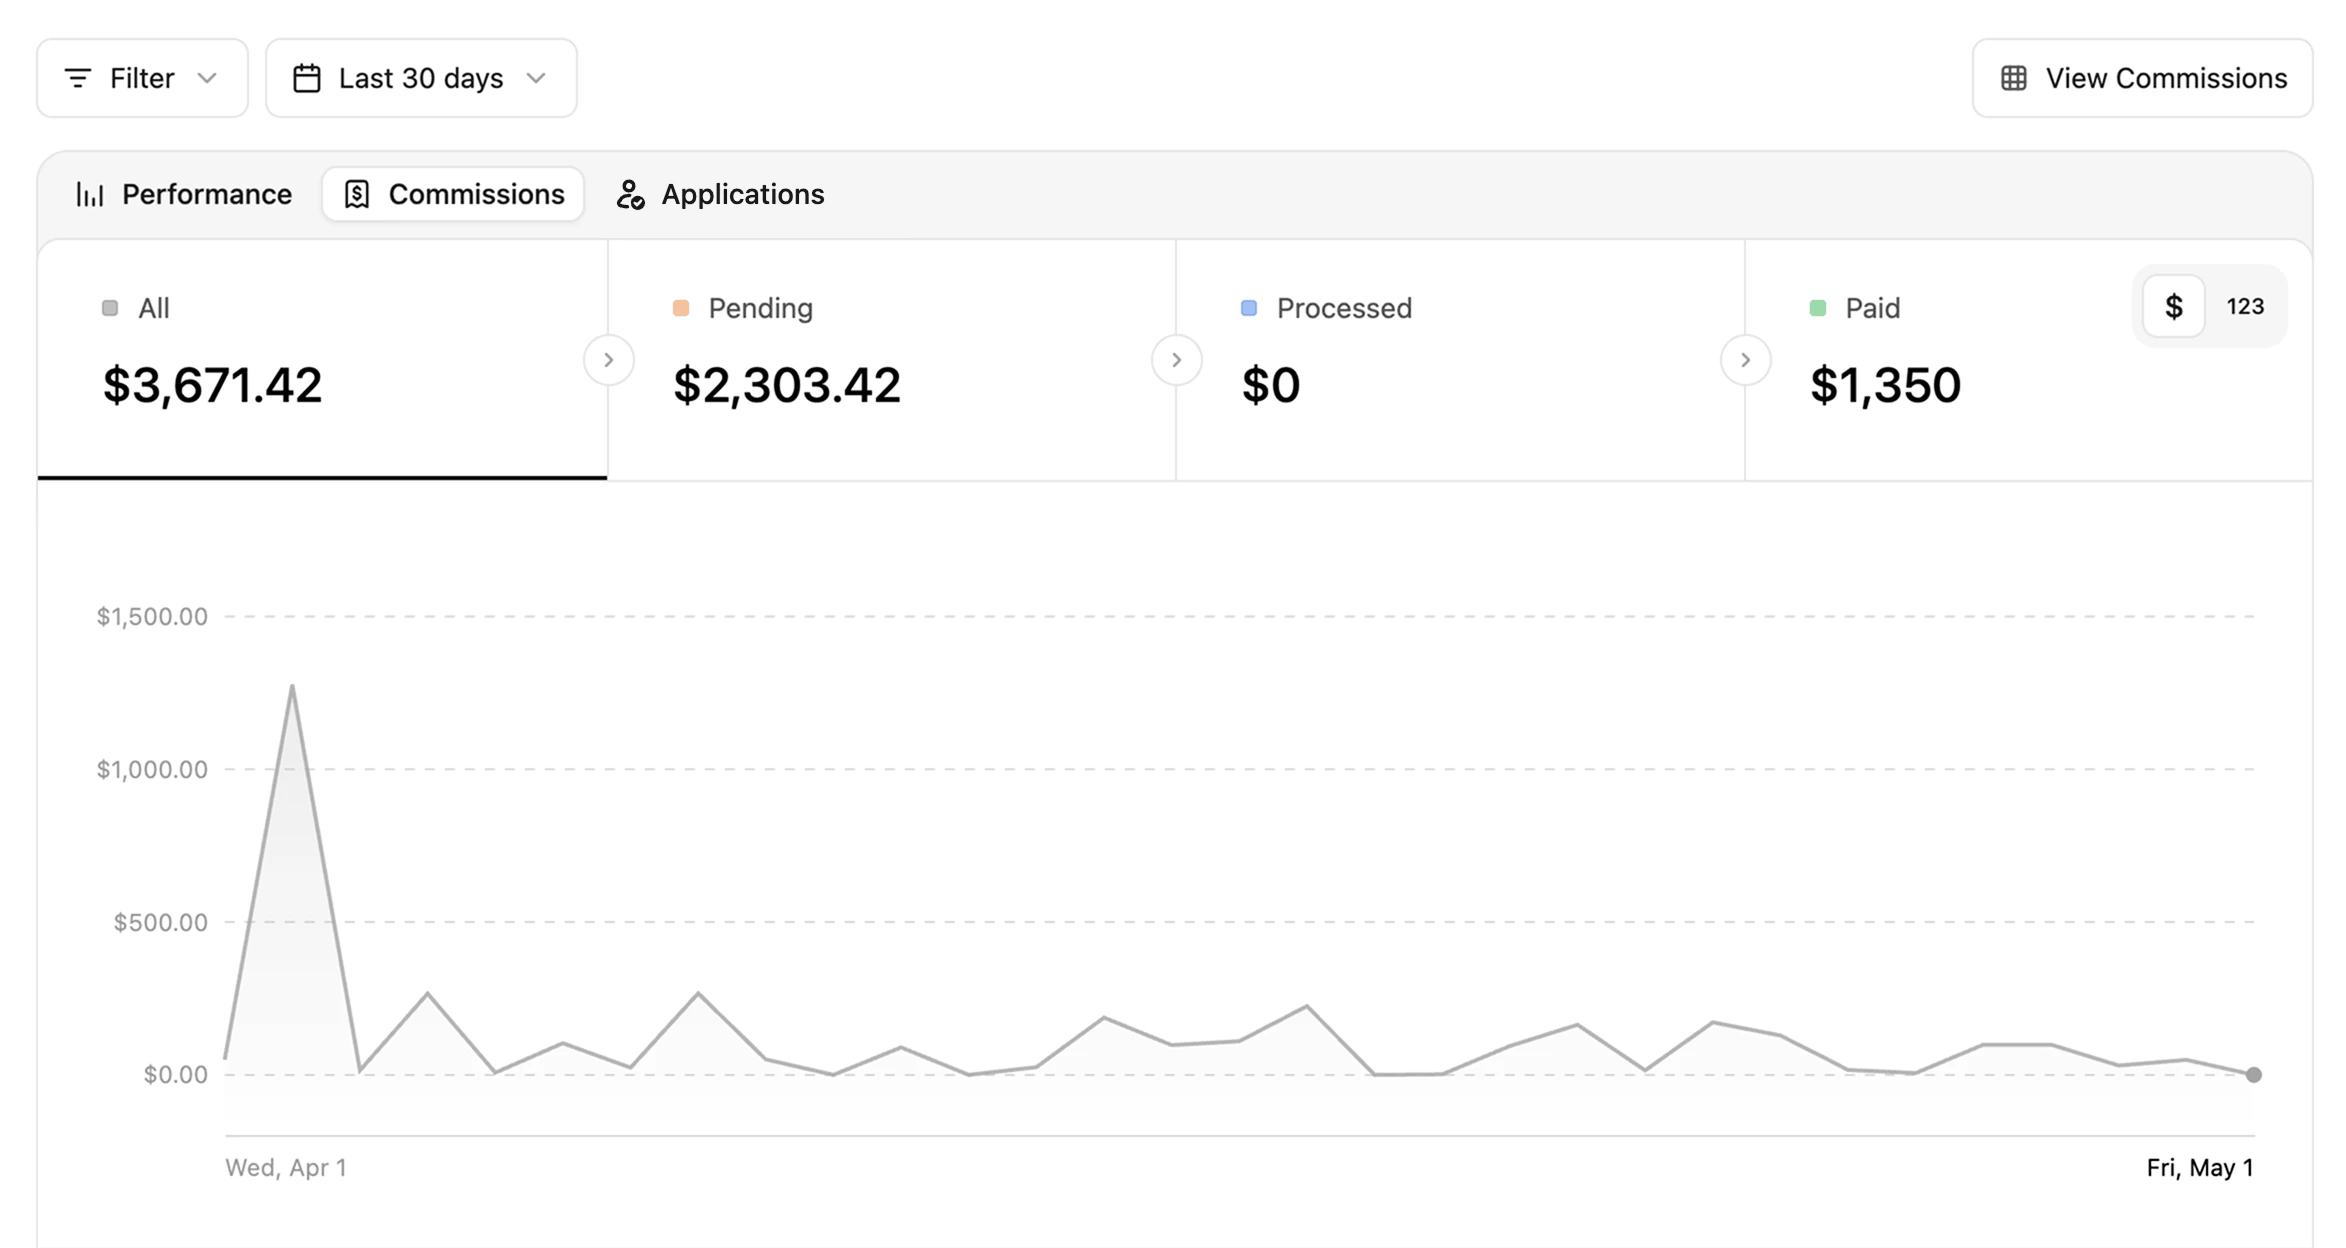
$ | 123 toggle in the top right of the data type section.
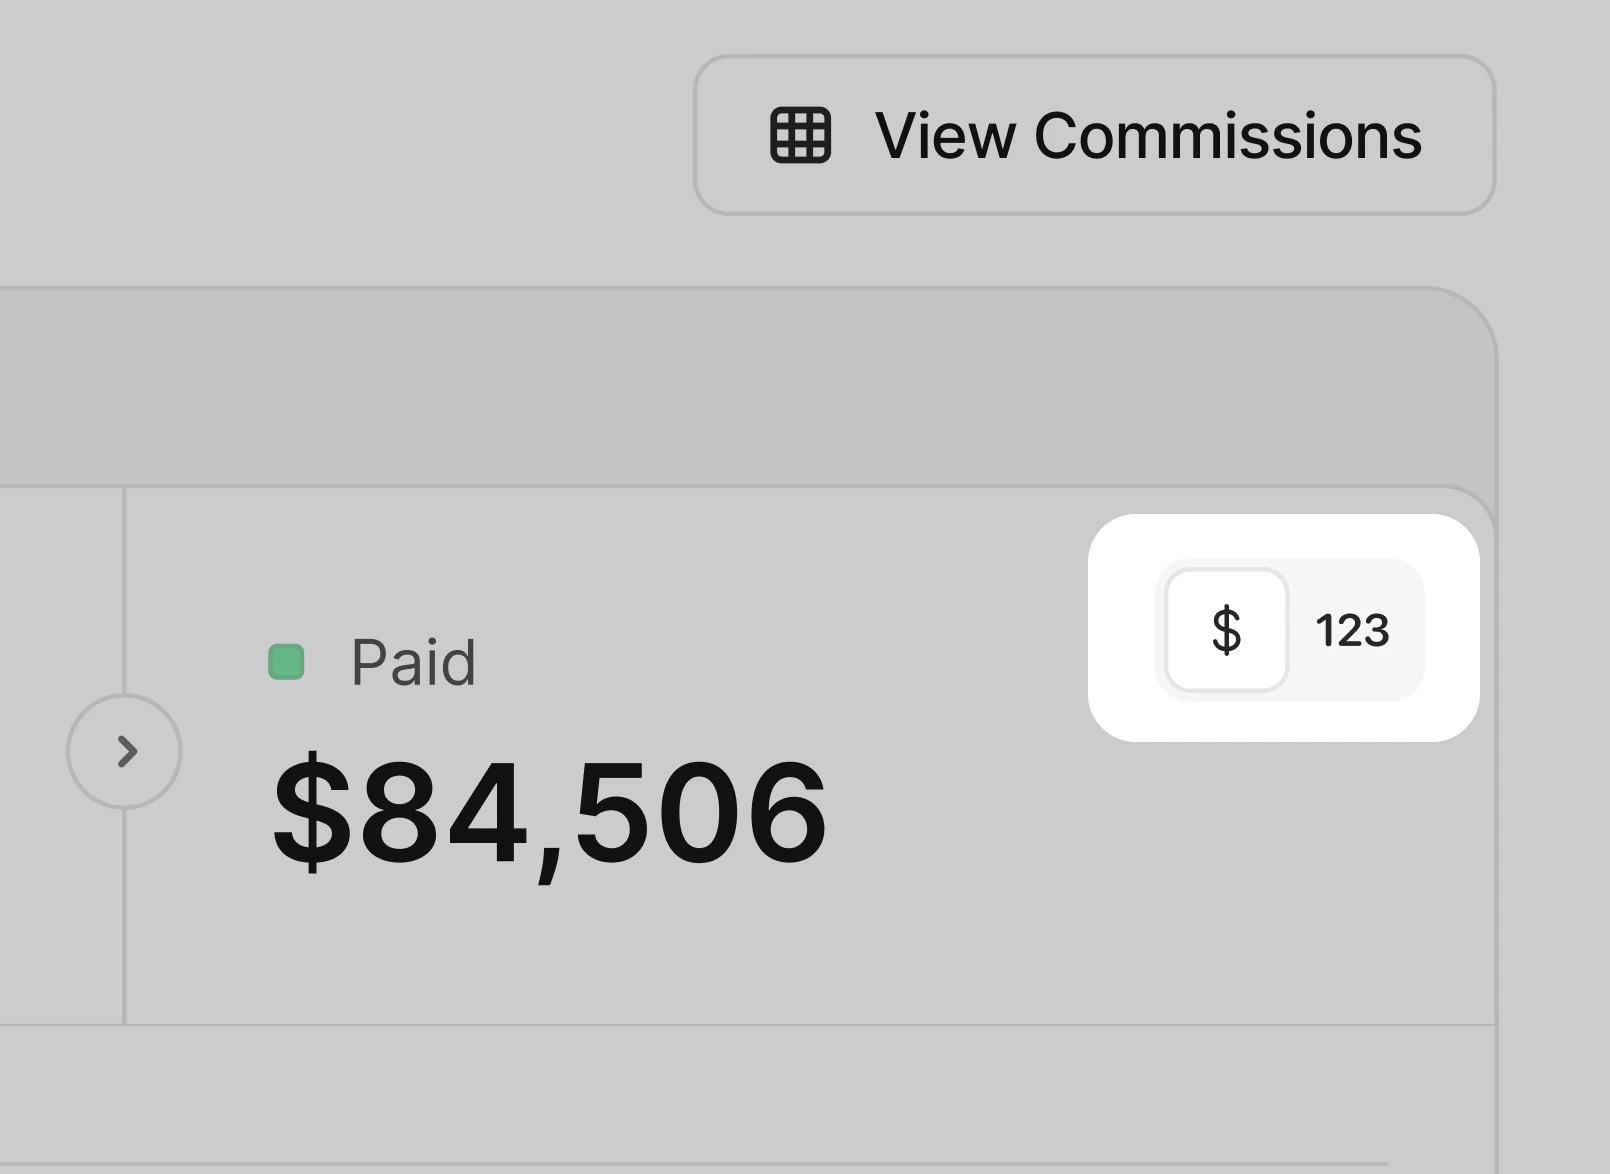
$ is selected to show commission value. Switching to 123 changes the chart to show the number of commissions instead.
2. Partner commission data
Below the chart, you can review partner-level commission performance for the selected period. This helps you identify which partners are generating the most commission activity.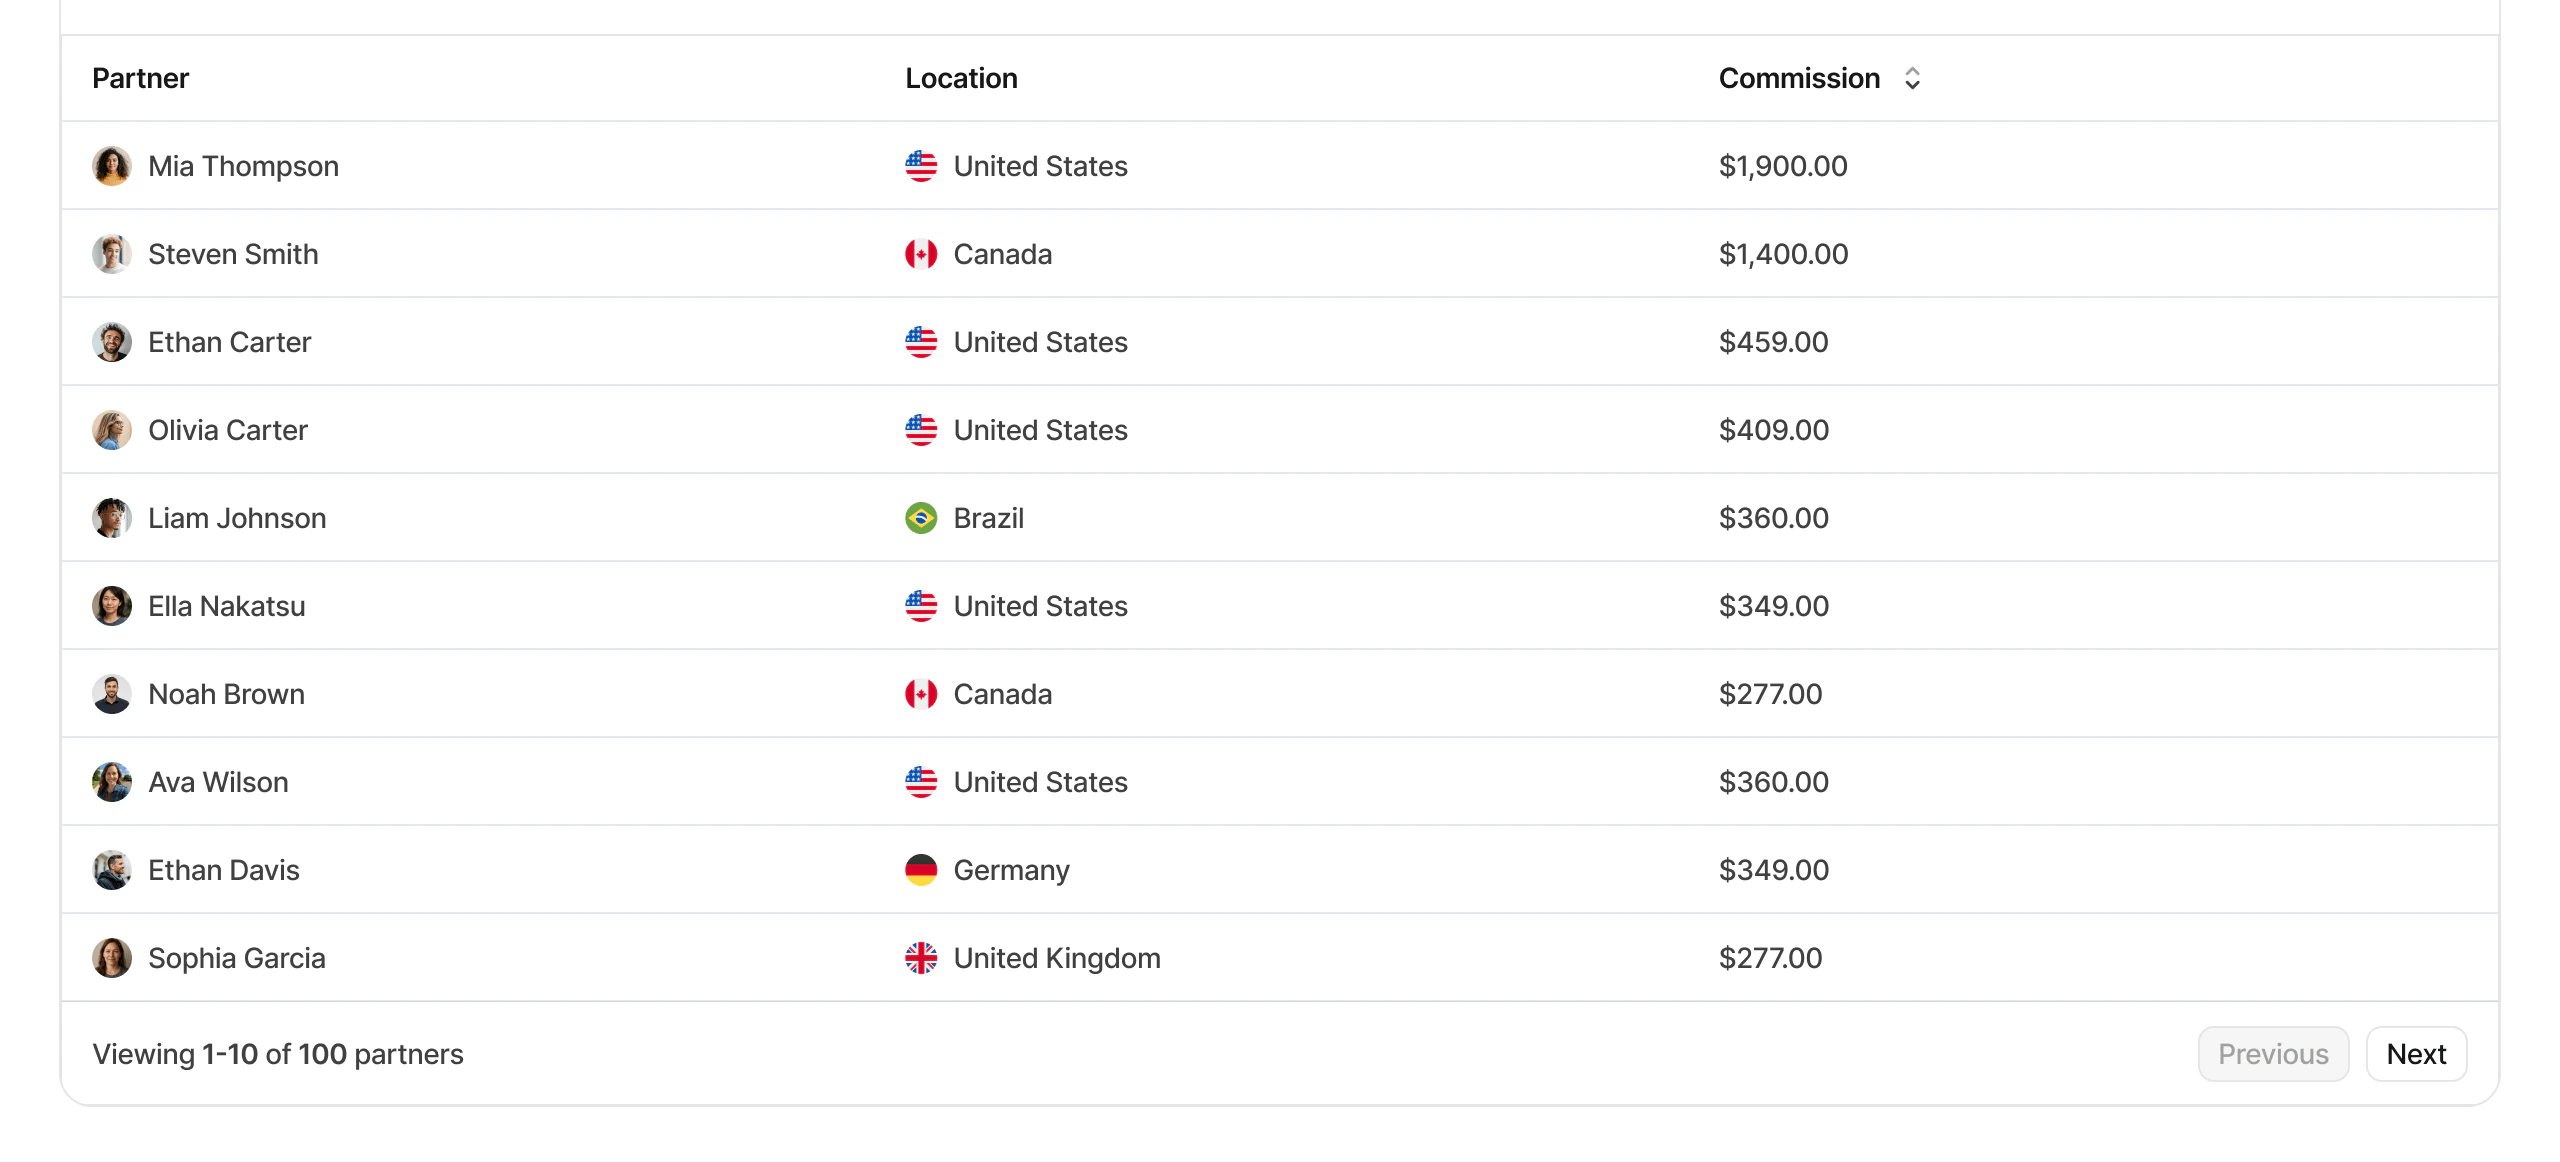
3. Aggregated data for different facets (top views)
These are more commonly known as the “Top Views” in Dub Analytics. These views show your top Partner Groups and commission Types, and allow you to explore your program data further.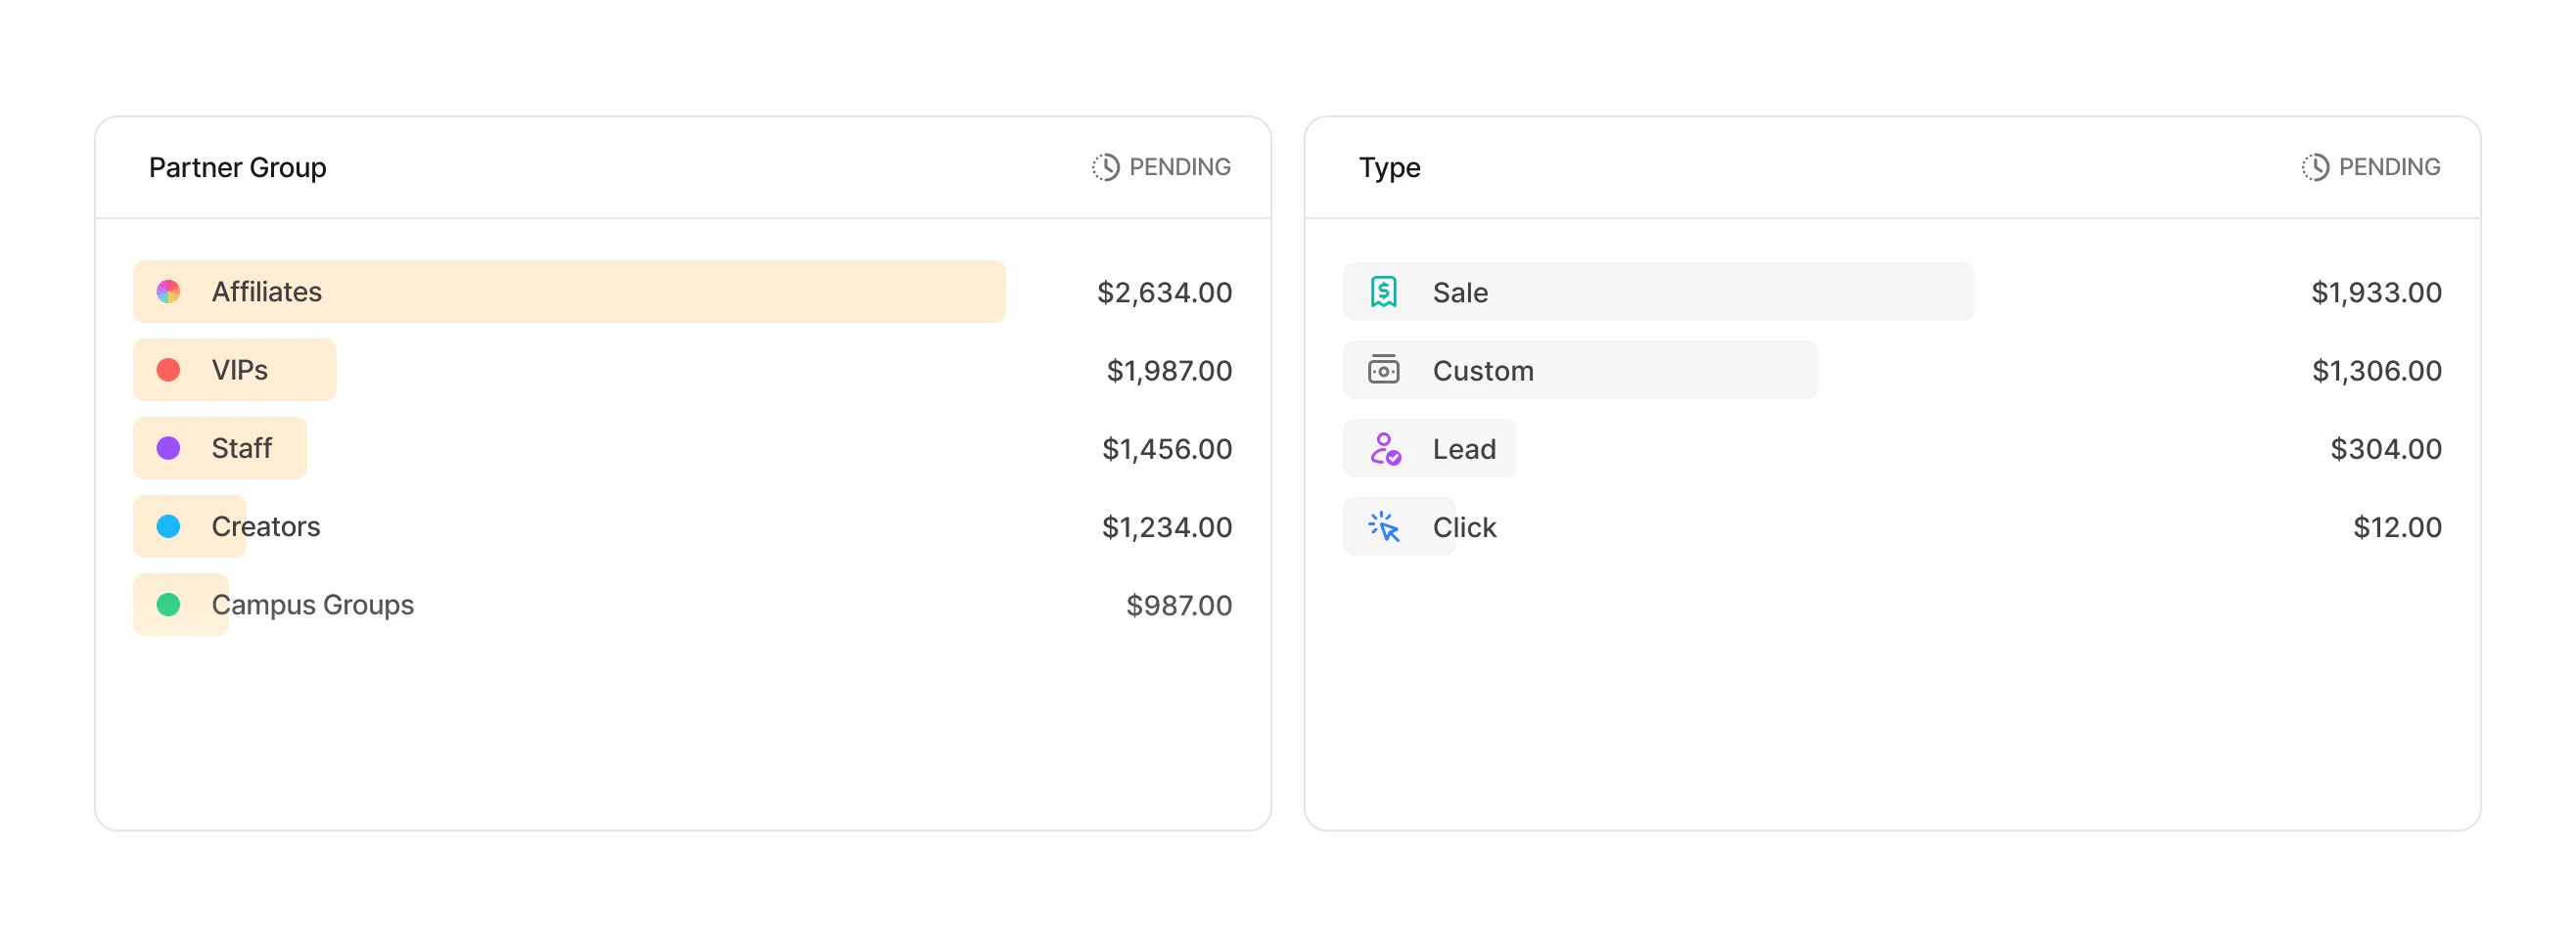
Filtering commission analytics
You can click the Filter button in the top left to narrow commission analytics by partner, group, and commission type. The date picker controls the reporting period for the commission chart and partner data.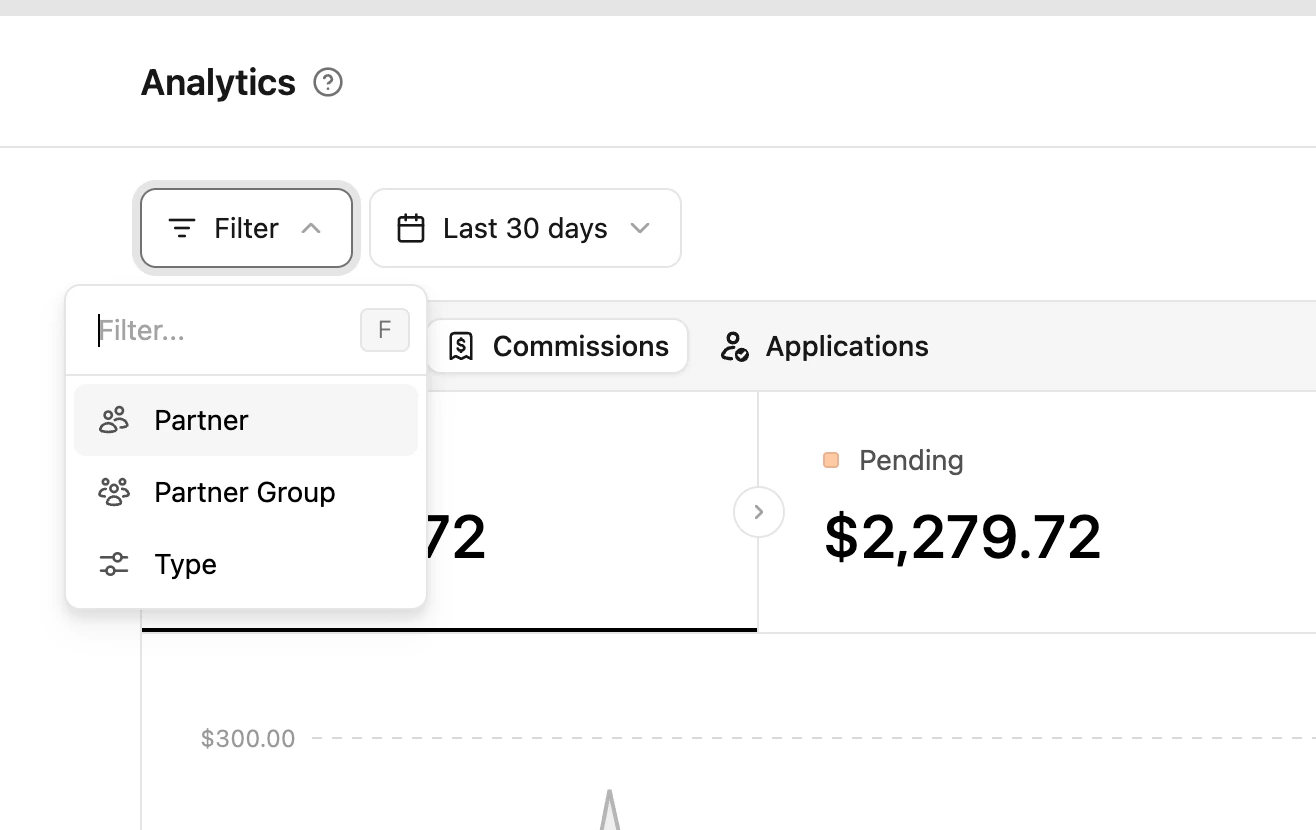
| Filter | Description |
|---|---|
| Partner | Select a specific program partner |
| Partner Group | Select a specific partner group |
| Partner Tag | Select a specific partner tag |
| Commission type | Select a specific commission type (eg: click, lead, sale) |