

Where to find application analytics?
When viewing your Partner Program navigation, click on the Analytics page in the Insights group. In the analytics chart, select Applications from the top data selector.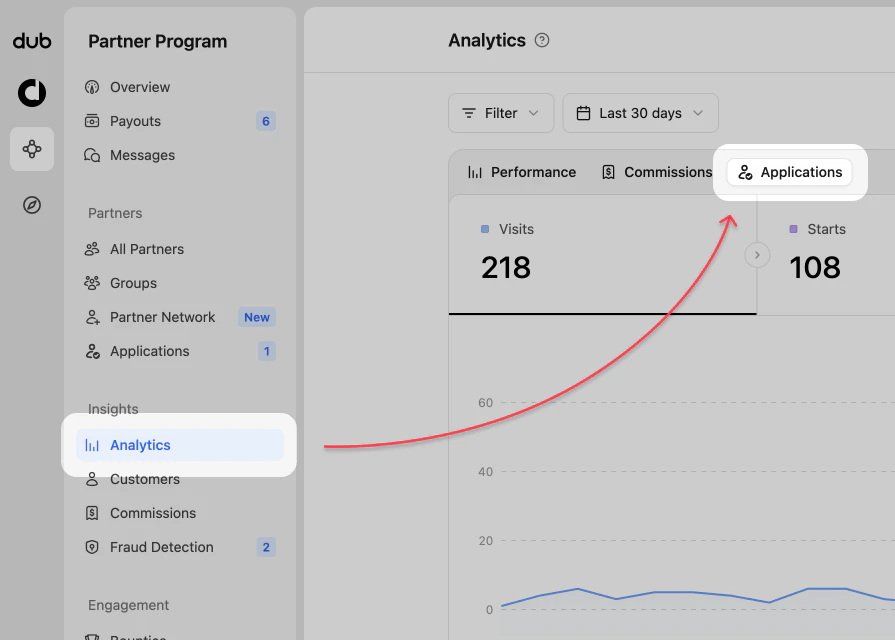
Application analytics views
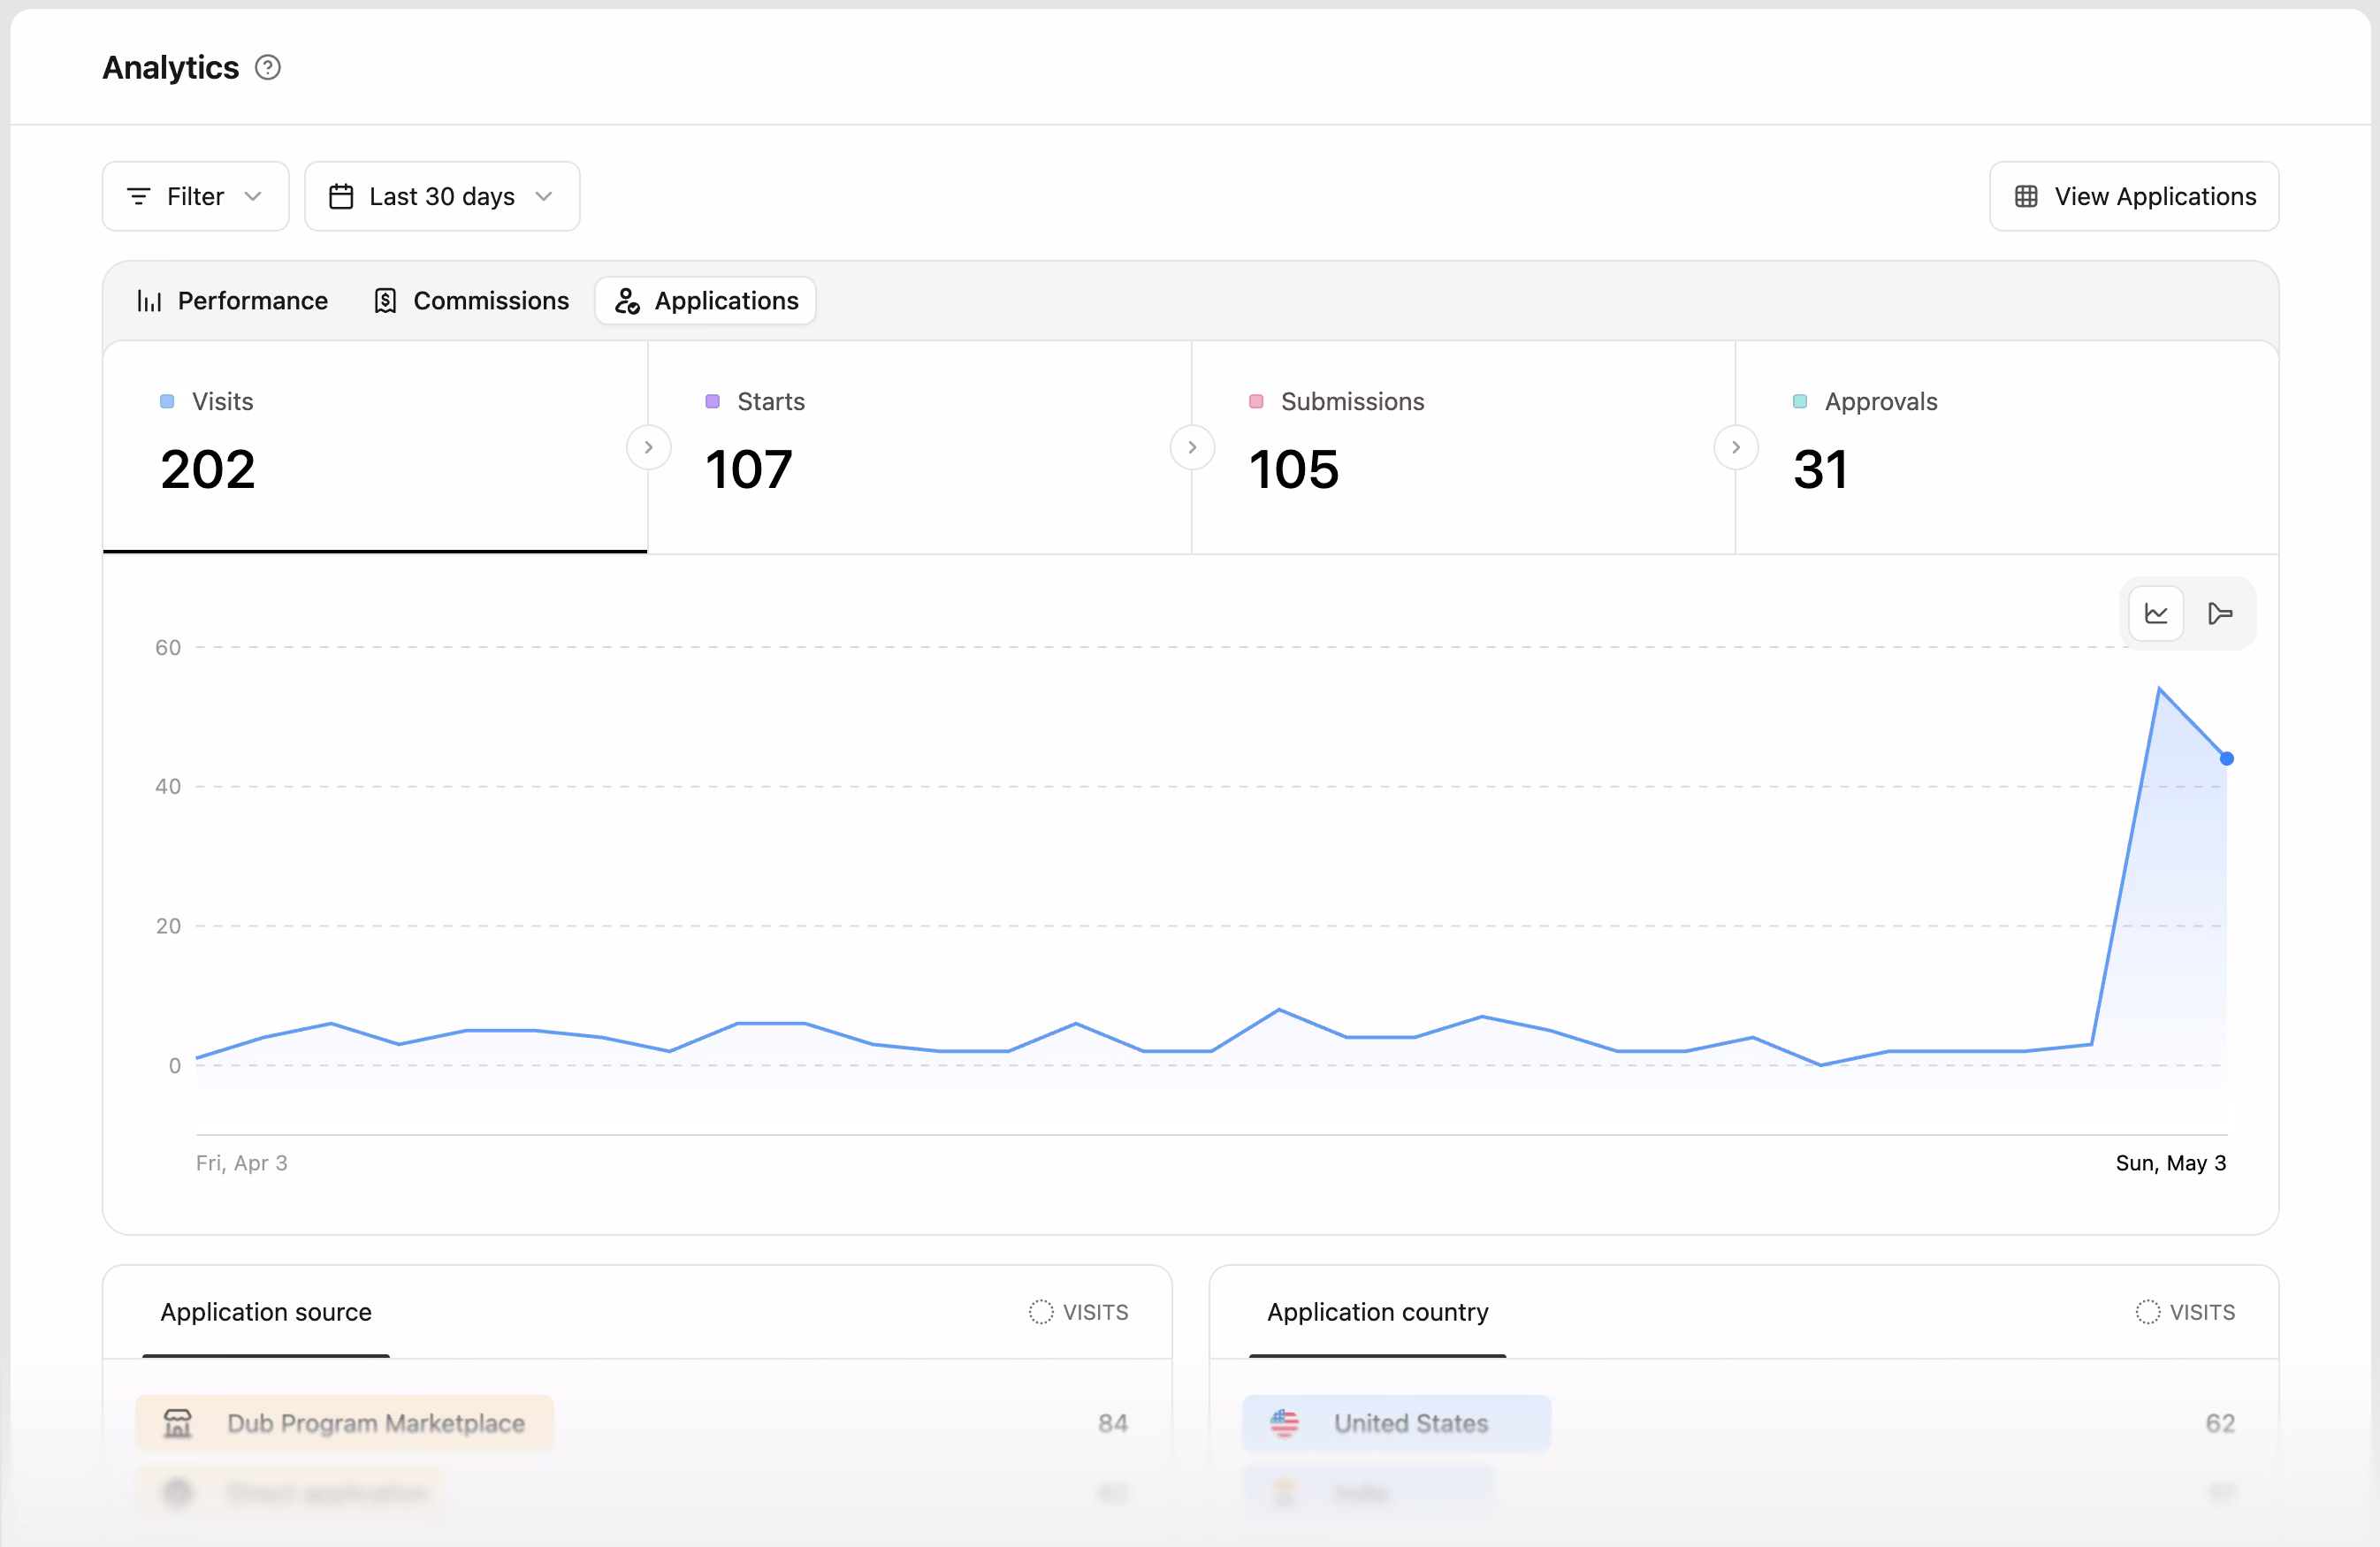
The application analytics dashboard uses filtering and date range controls like the program analytics, but focuses the chart on application acquisition and approval flow.1. Application chart
The application chart shows application activity across the selected date range. You can use it to identify spikes, dips, and trends in how potential partners move through the application process.| Step | Description |
|---|---|
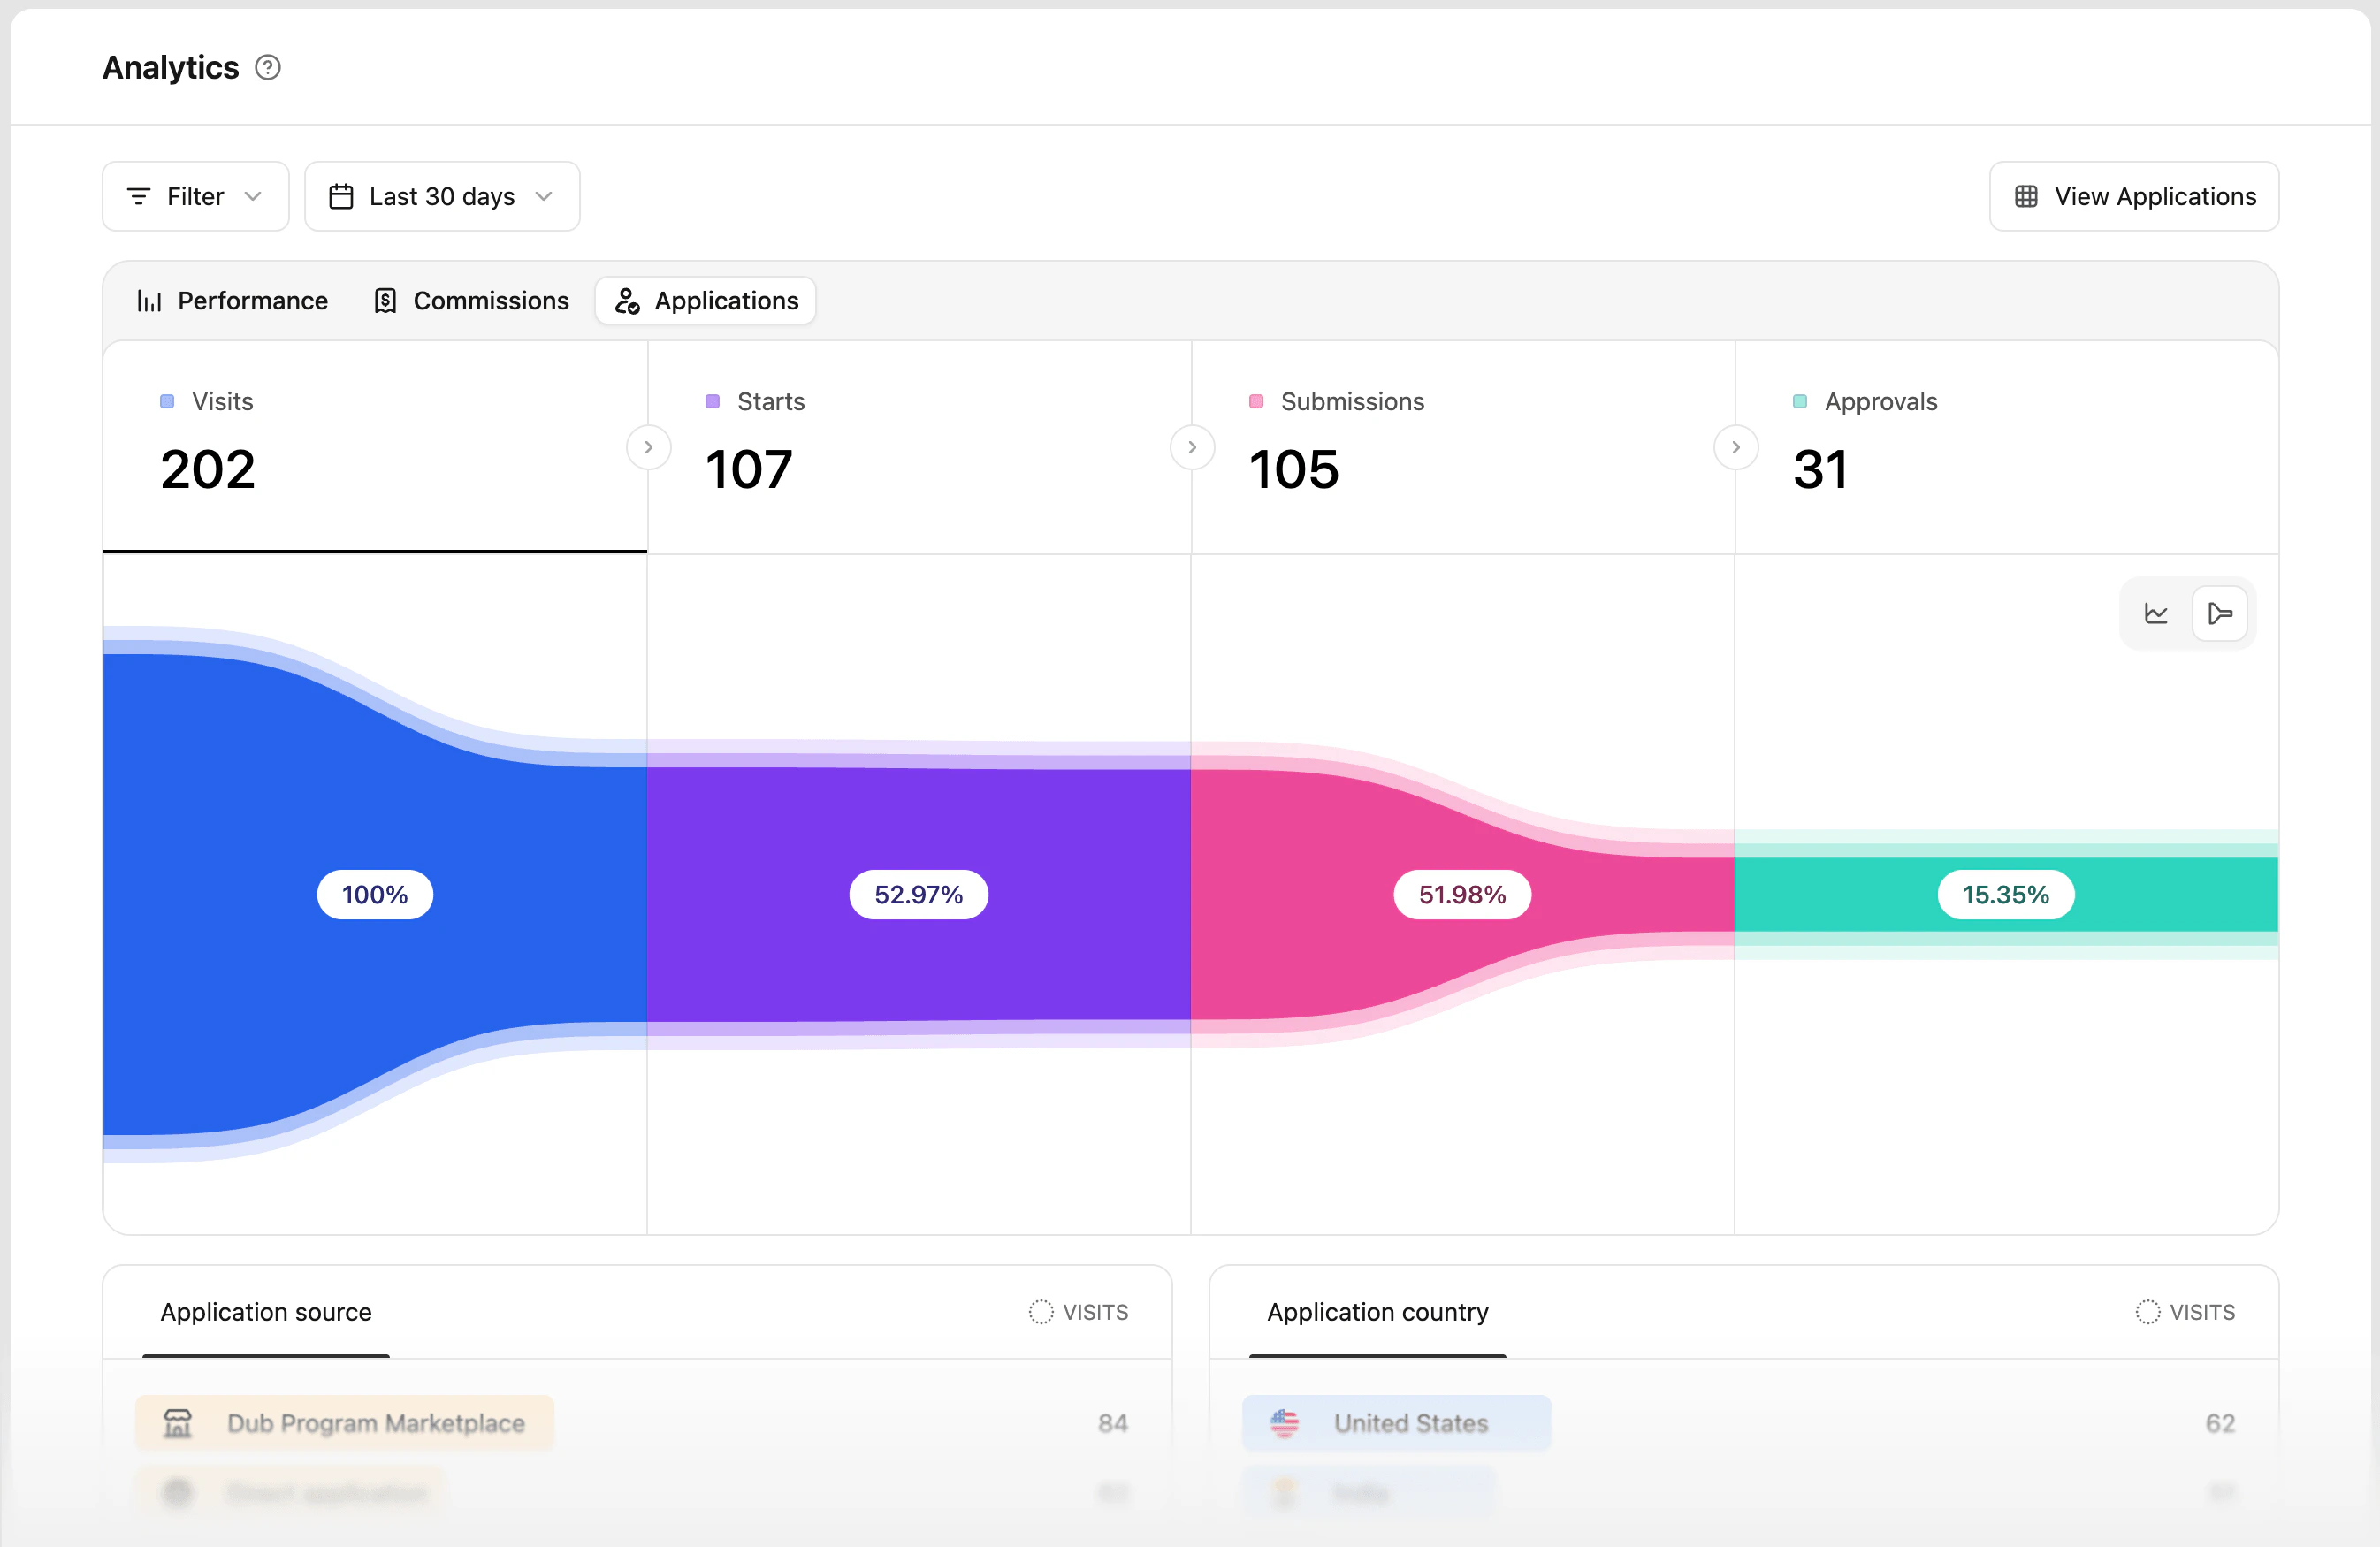
| Visits | People who visited your program application page |
| Starts | Visitors who started the application form |
| Submissions | Applicants who submitted the application form |
| Approvals | Submitted applications that were approved |
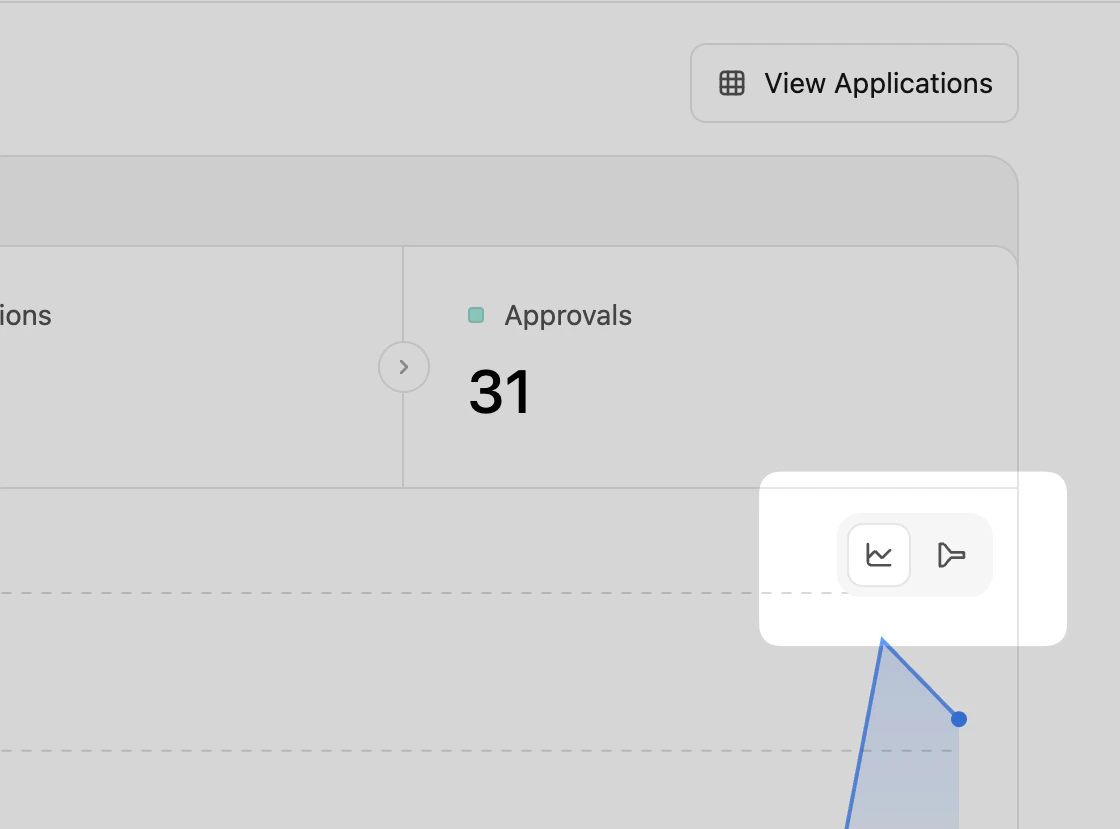
time-chart | application funnel toggle in the top right of the chart area.
2. Aggregated data for different facets (top views)
These are more commonly known as the “Top Views” in Dub Analytics. These views show your top application Sources and Countries, and allow you to explore your program data further. Use Application source to identify which sources are driving application interest, such as the Dub Program Marketplace, direct applications, referrers, and other websites that send traffic to your program. Use Application country to compare application demand across countries, understand where your program is attracting partners, and decide whether your application settings or partner groups should be tailored by region.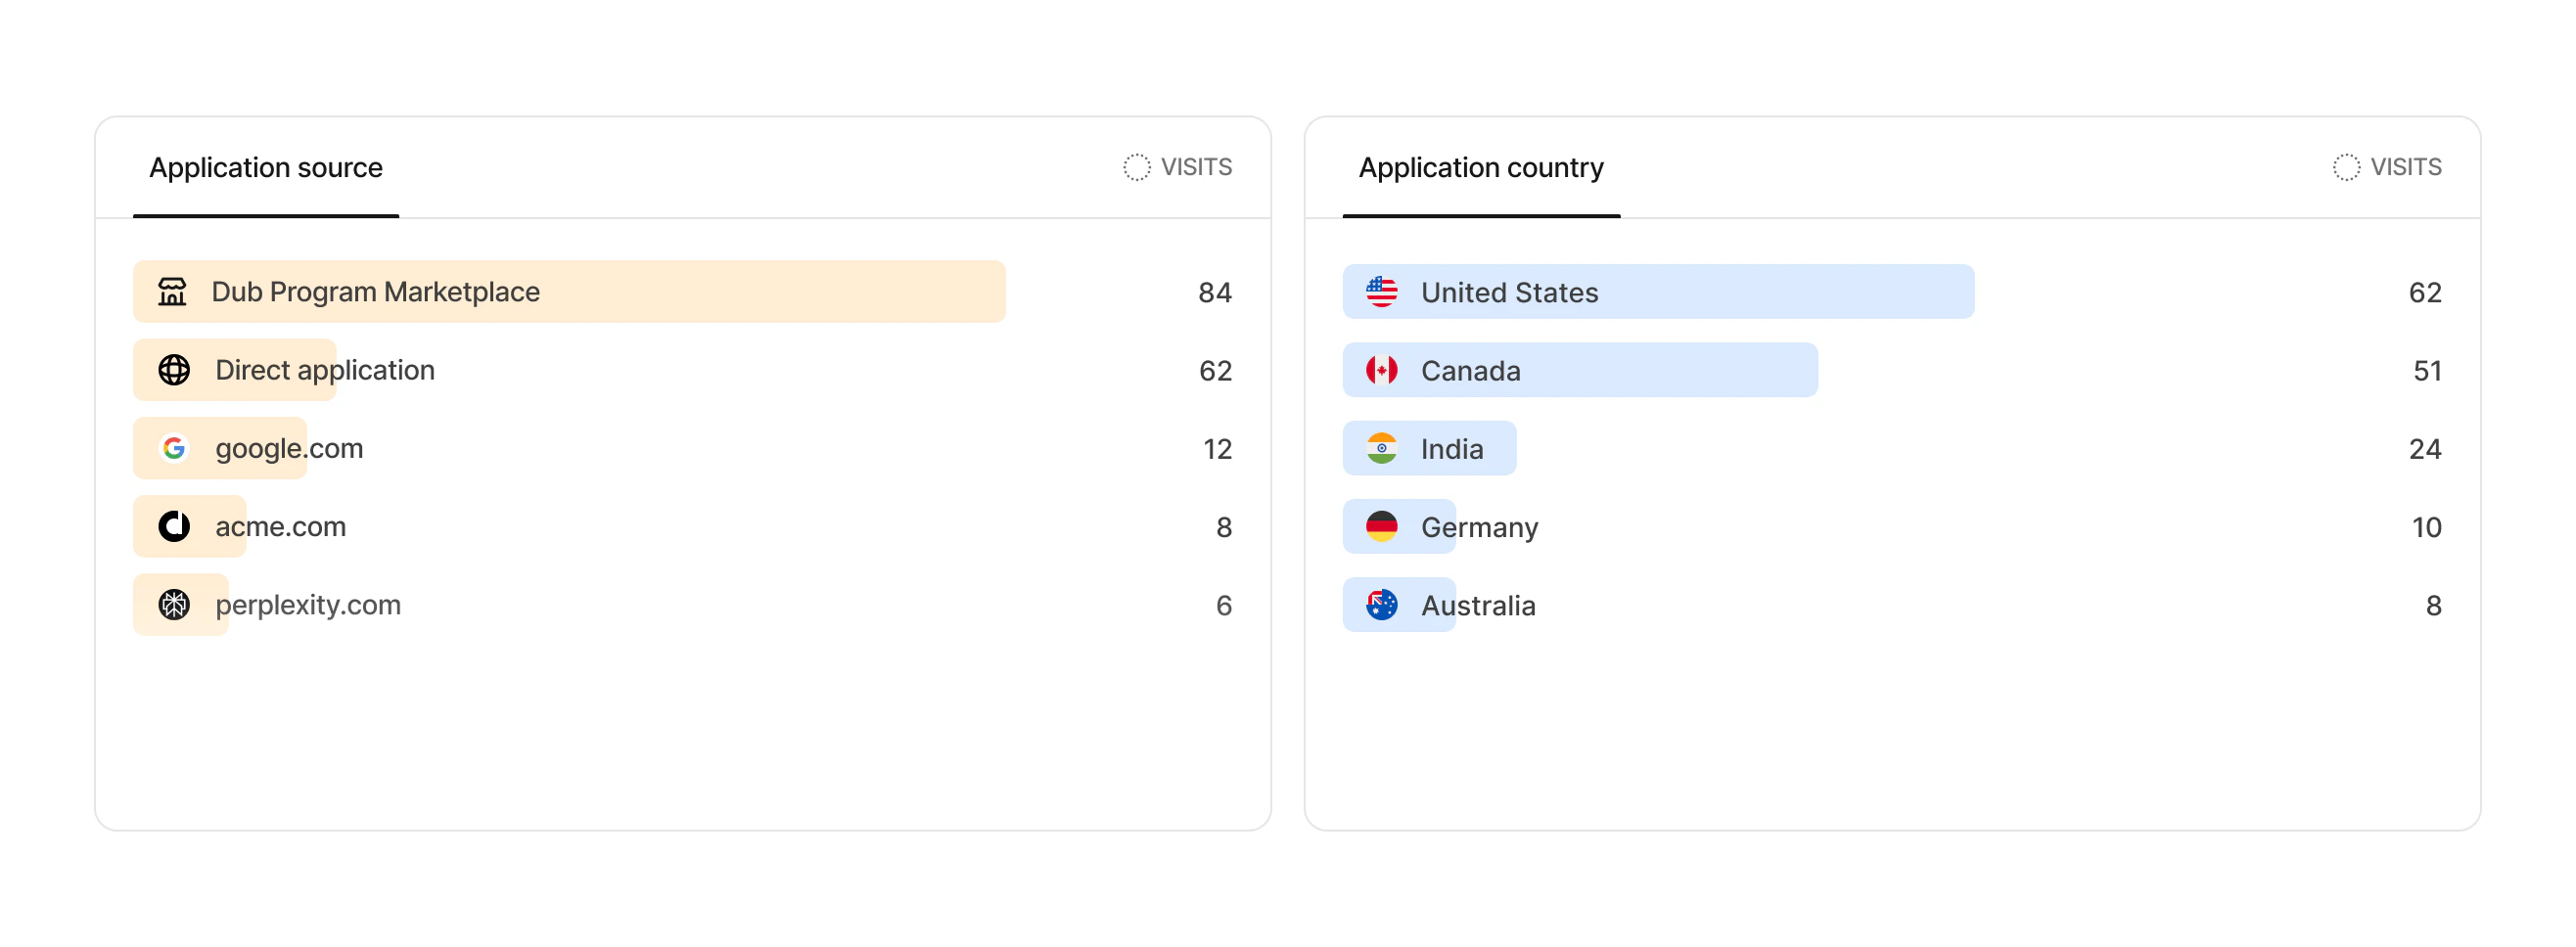
Reviewing applications
To review the applicants behind your application analytics, click View Applications in the top right of the analytics page.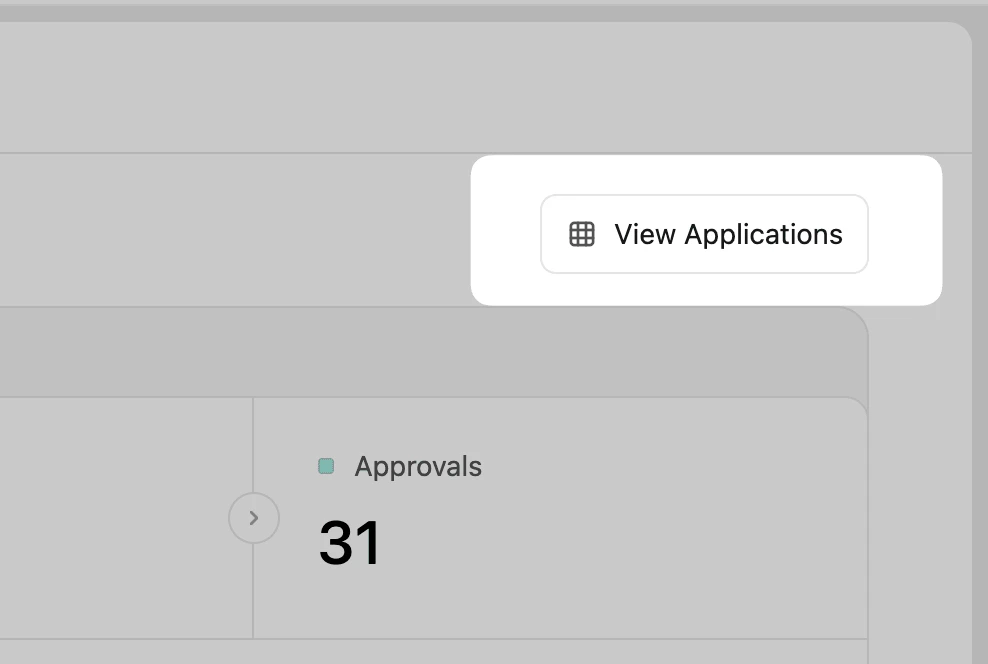
Filtering application analytics
You can click the Filter button in the top left to narrow application analytics by partner, application source, and country.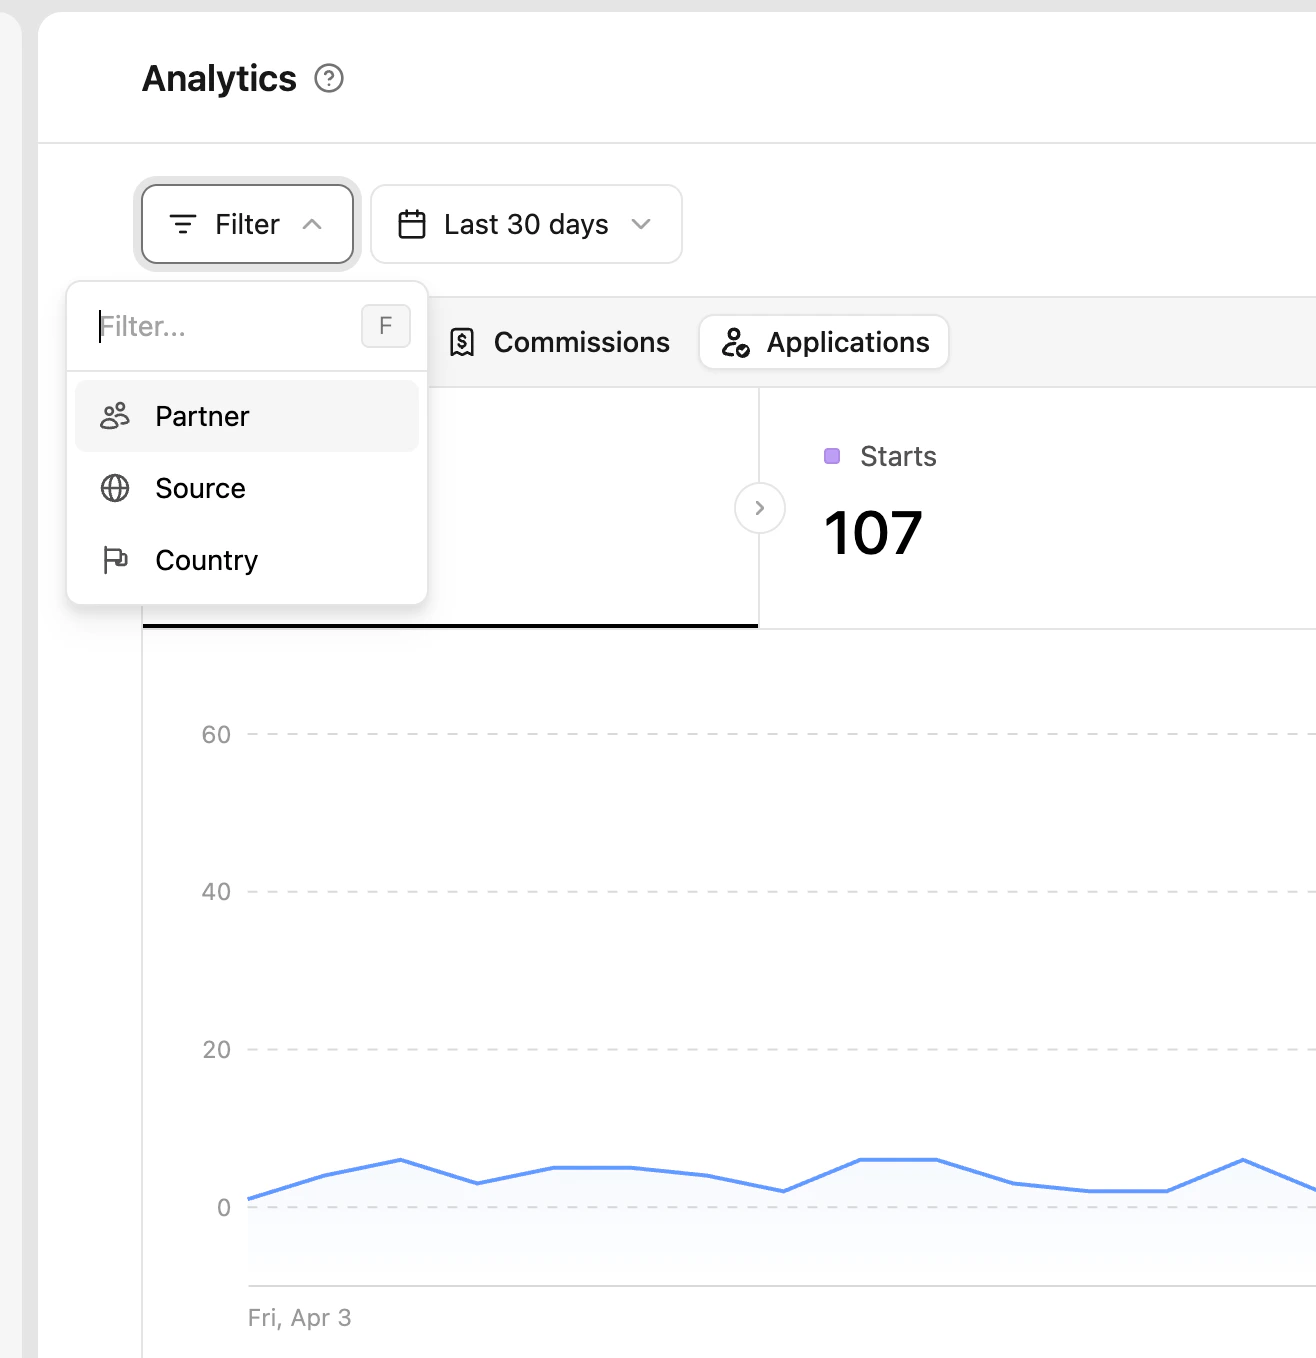
| Filter | Description |
|---|---|
| Partner | Select a specific program partner |
| Source | Select a specific application source |
| Country | Select a specific country where applications start |