> ## Documentation Index
> Fetch the complete documentation index at: https://dub.co/llms.txt
> Use this file to discover all available pages before exploring further.
# Real-time events stream
> Learn more about Dub's real-time events stream feature and how you can use it to gain deeper insights into your engagement data.
This feature is only available on [Dub's Business
plan](https://dub.co/pricing) and above.
On any given day, we track upwards of **1,000,000 click events** at Dub.
These events are ingested into our data warehouse, which is then materialized in a comprehensive, [real-time analytics dashboard](/help/article/dub-analytics) that gives you powerful insights into your user base.
While this is great, it is still an aggregated view of your data. What if you want to see a chronological stream of click events and export them for further analysis?
**This is where Dub's Real-time Events Stream feature comes in.**
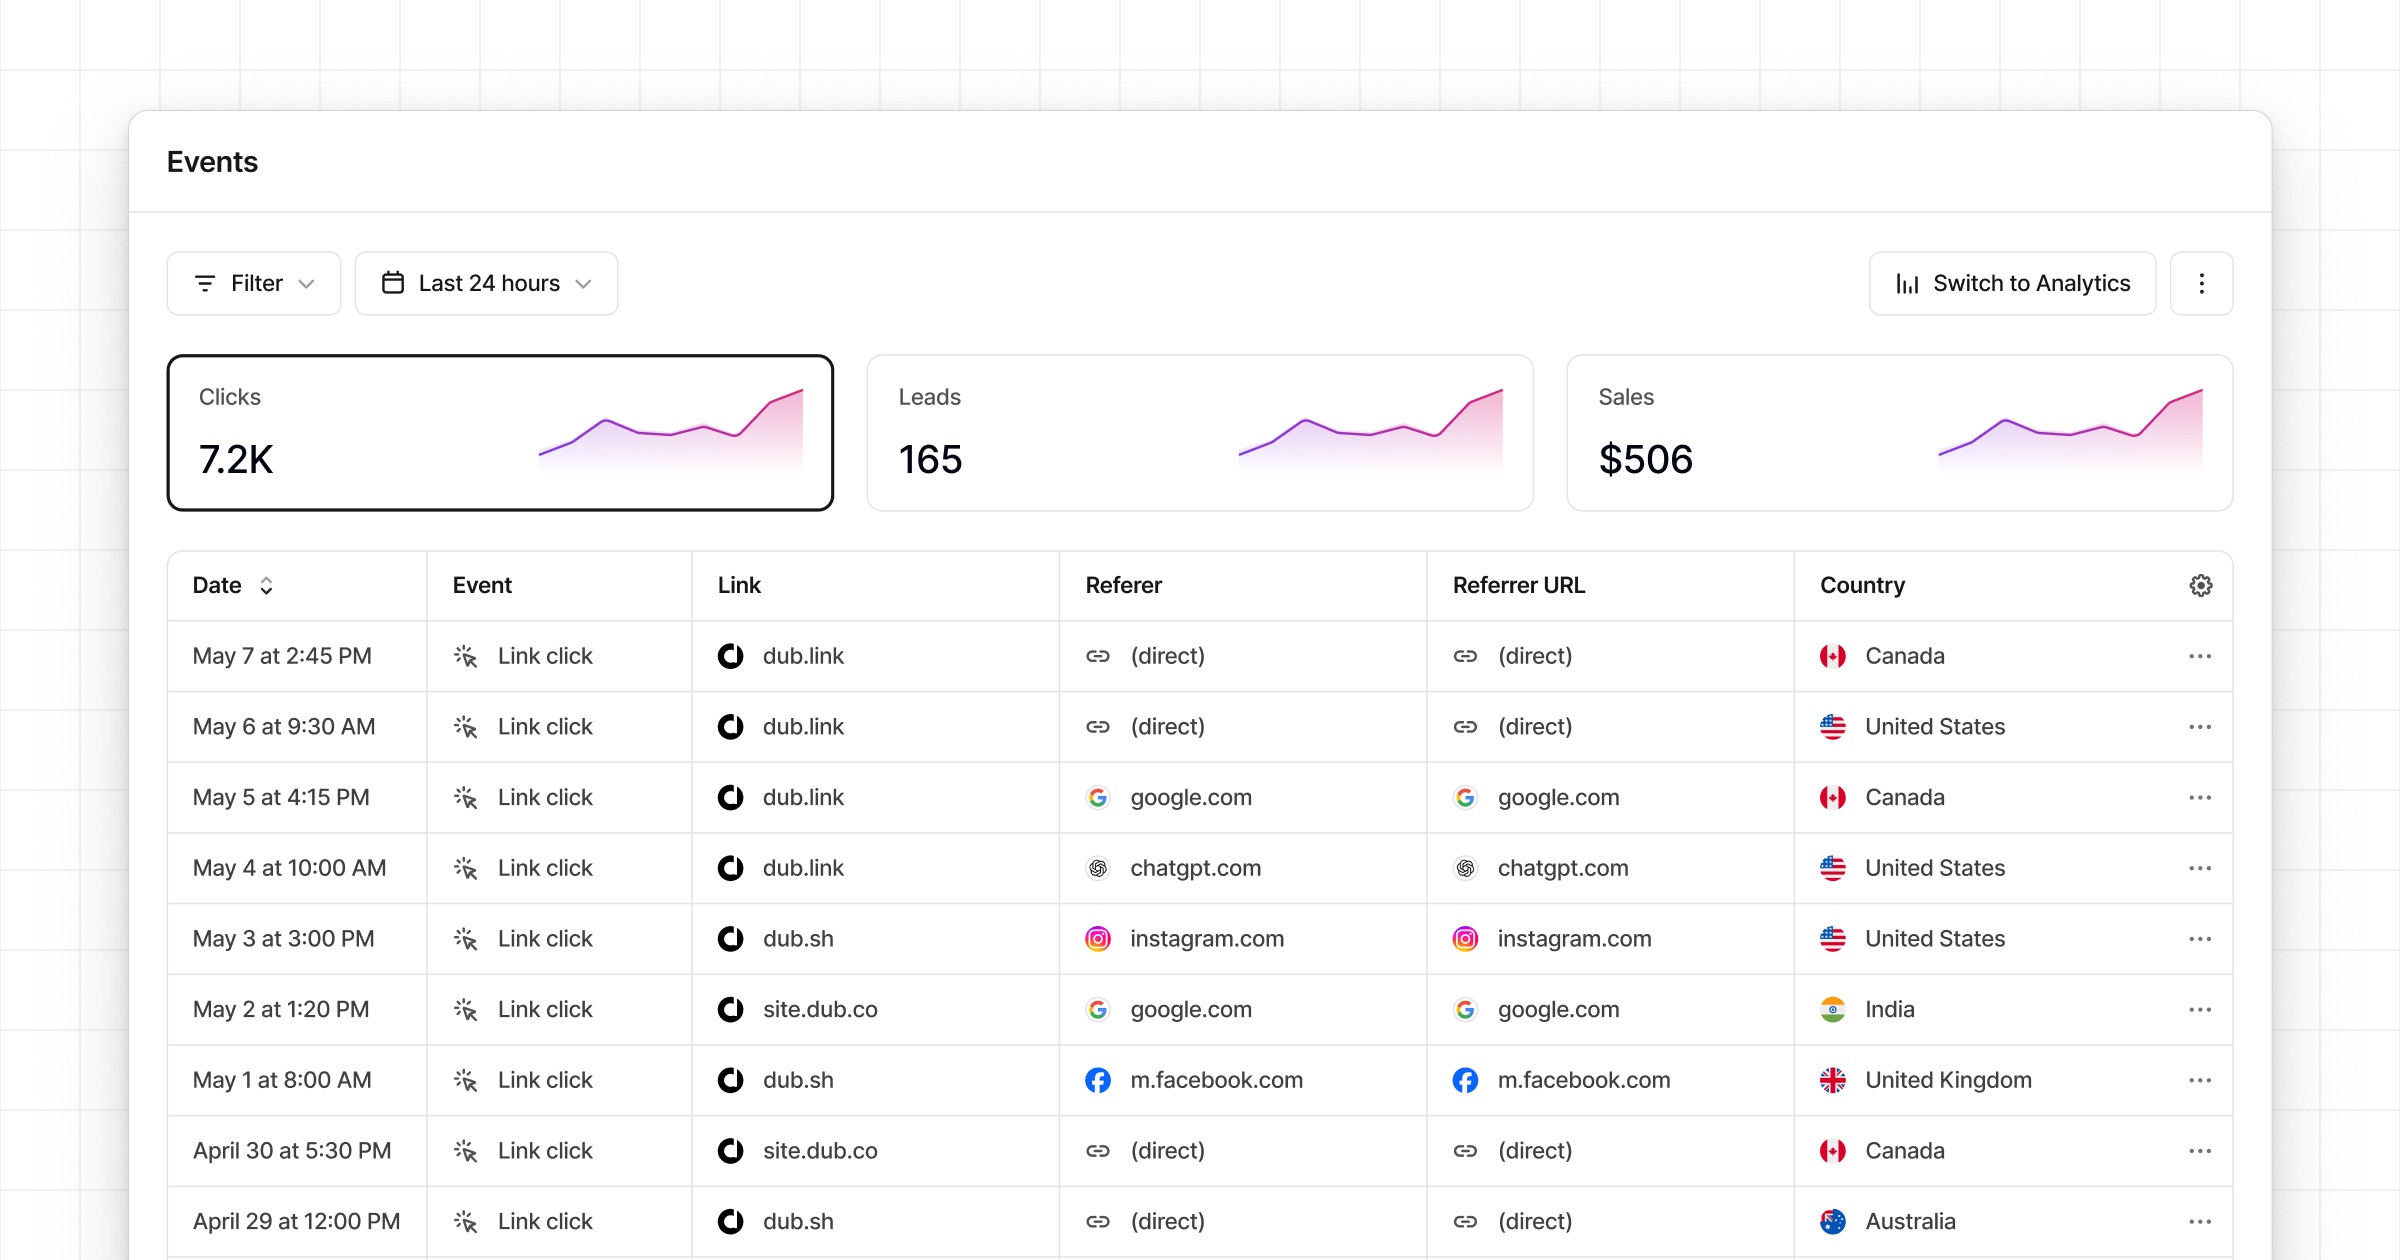
Dub's Real-time Events Stream is a detailed, real-time stream of events across your entire Dub workspace.
 ## Where can I access it?
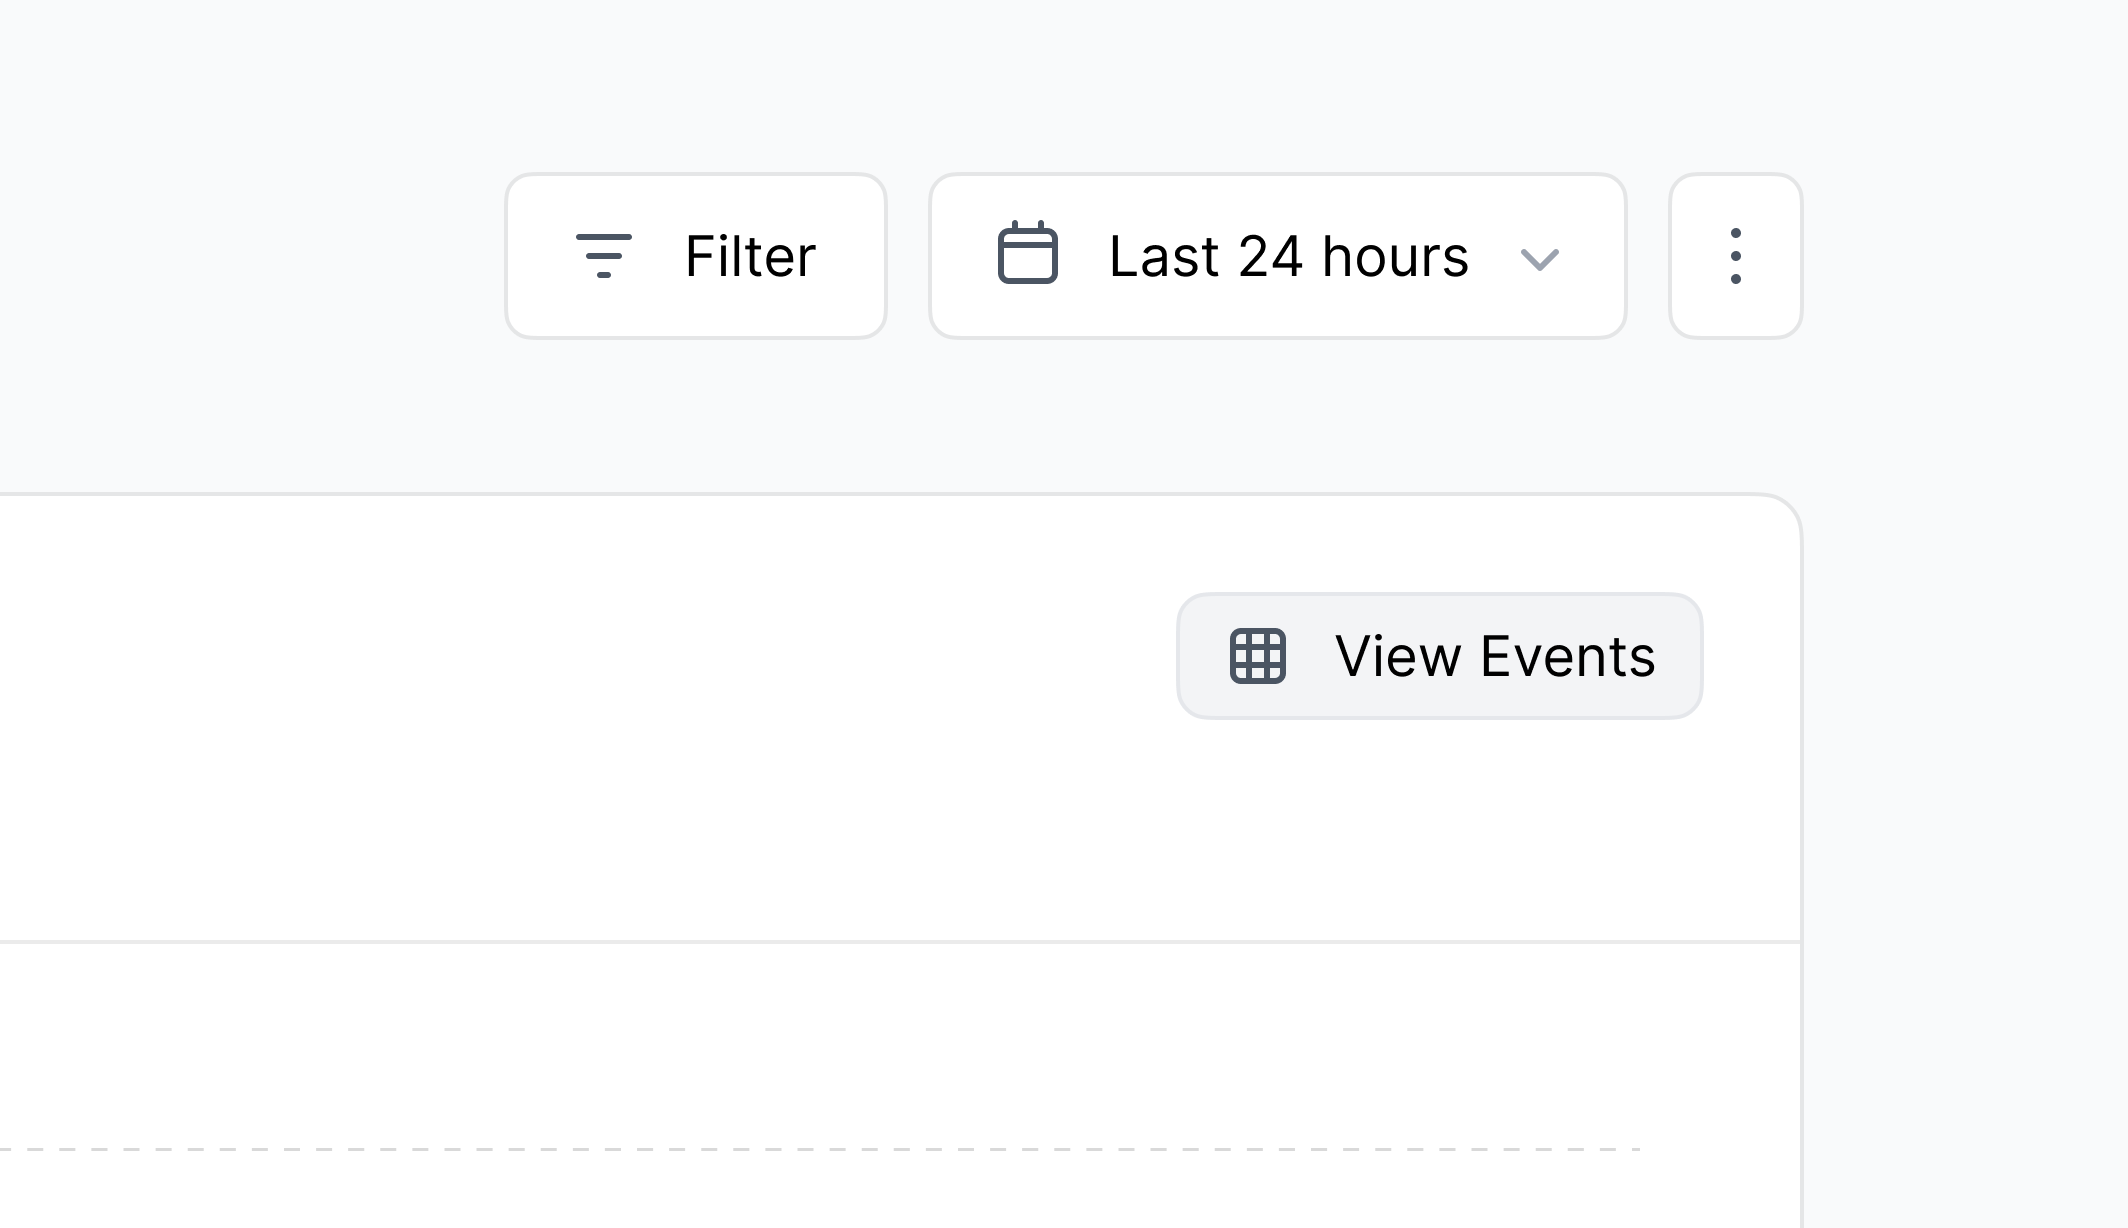
The real-time events stream lives in your workspace's [**Events** tab](https://app.dub.co/events), but you can also access it via the **View Events** button in the Analytics tab:
## Where can I access it?
The real-time events stream lives in your workspace's [**Events** tab](https://app.dub.co/events), but you can also access it via the **View Events** button in the Analytics tab:
 When you click on the **View Events** button, the same filters you have
applied in the Analytics tab are applied to the Events tab as well.
The events stream is real-time by default – meaning every click event that is recorded will show up in your Events tab in real-time.
## Customizing your events table
You can also customize the dashboard to only show the columns you are interested in:
When you click on the **View Events** button, the same filters you have
applied in the Analytics tab are applied to the Events tab as well.
The events stream is real-time by default – meaning every click event that is recorded will show up in your Events tab in real-time.
## Customizing your events table
You can also customize the dashboard to only show the columns you are interested in:
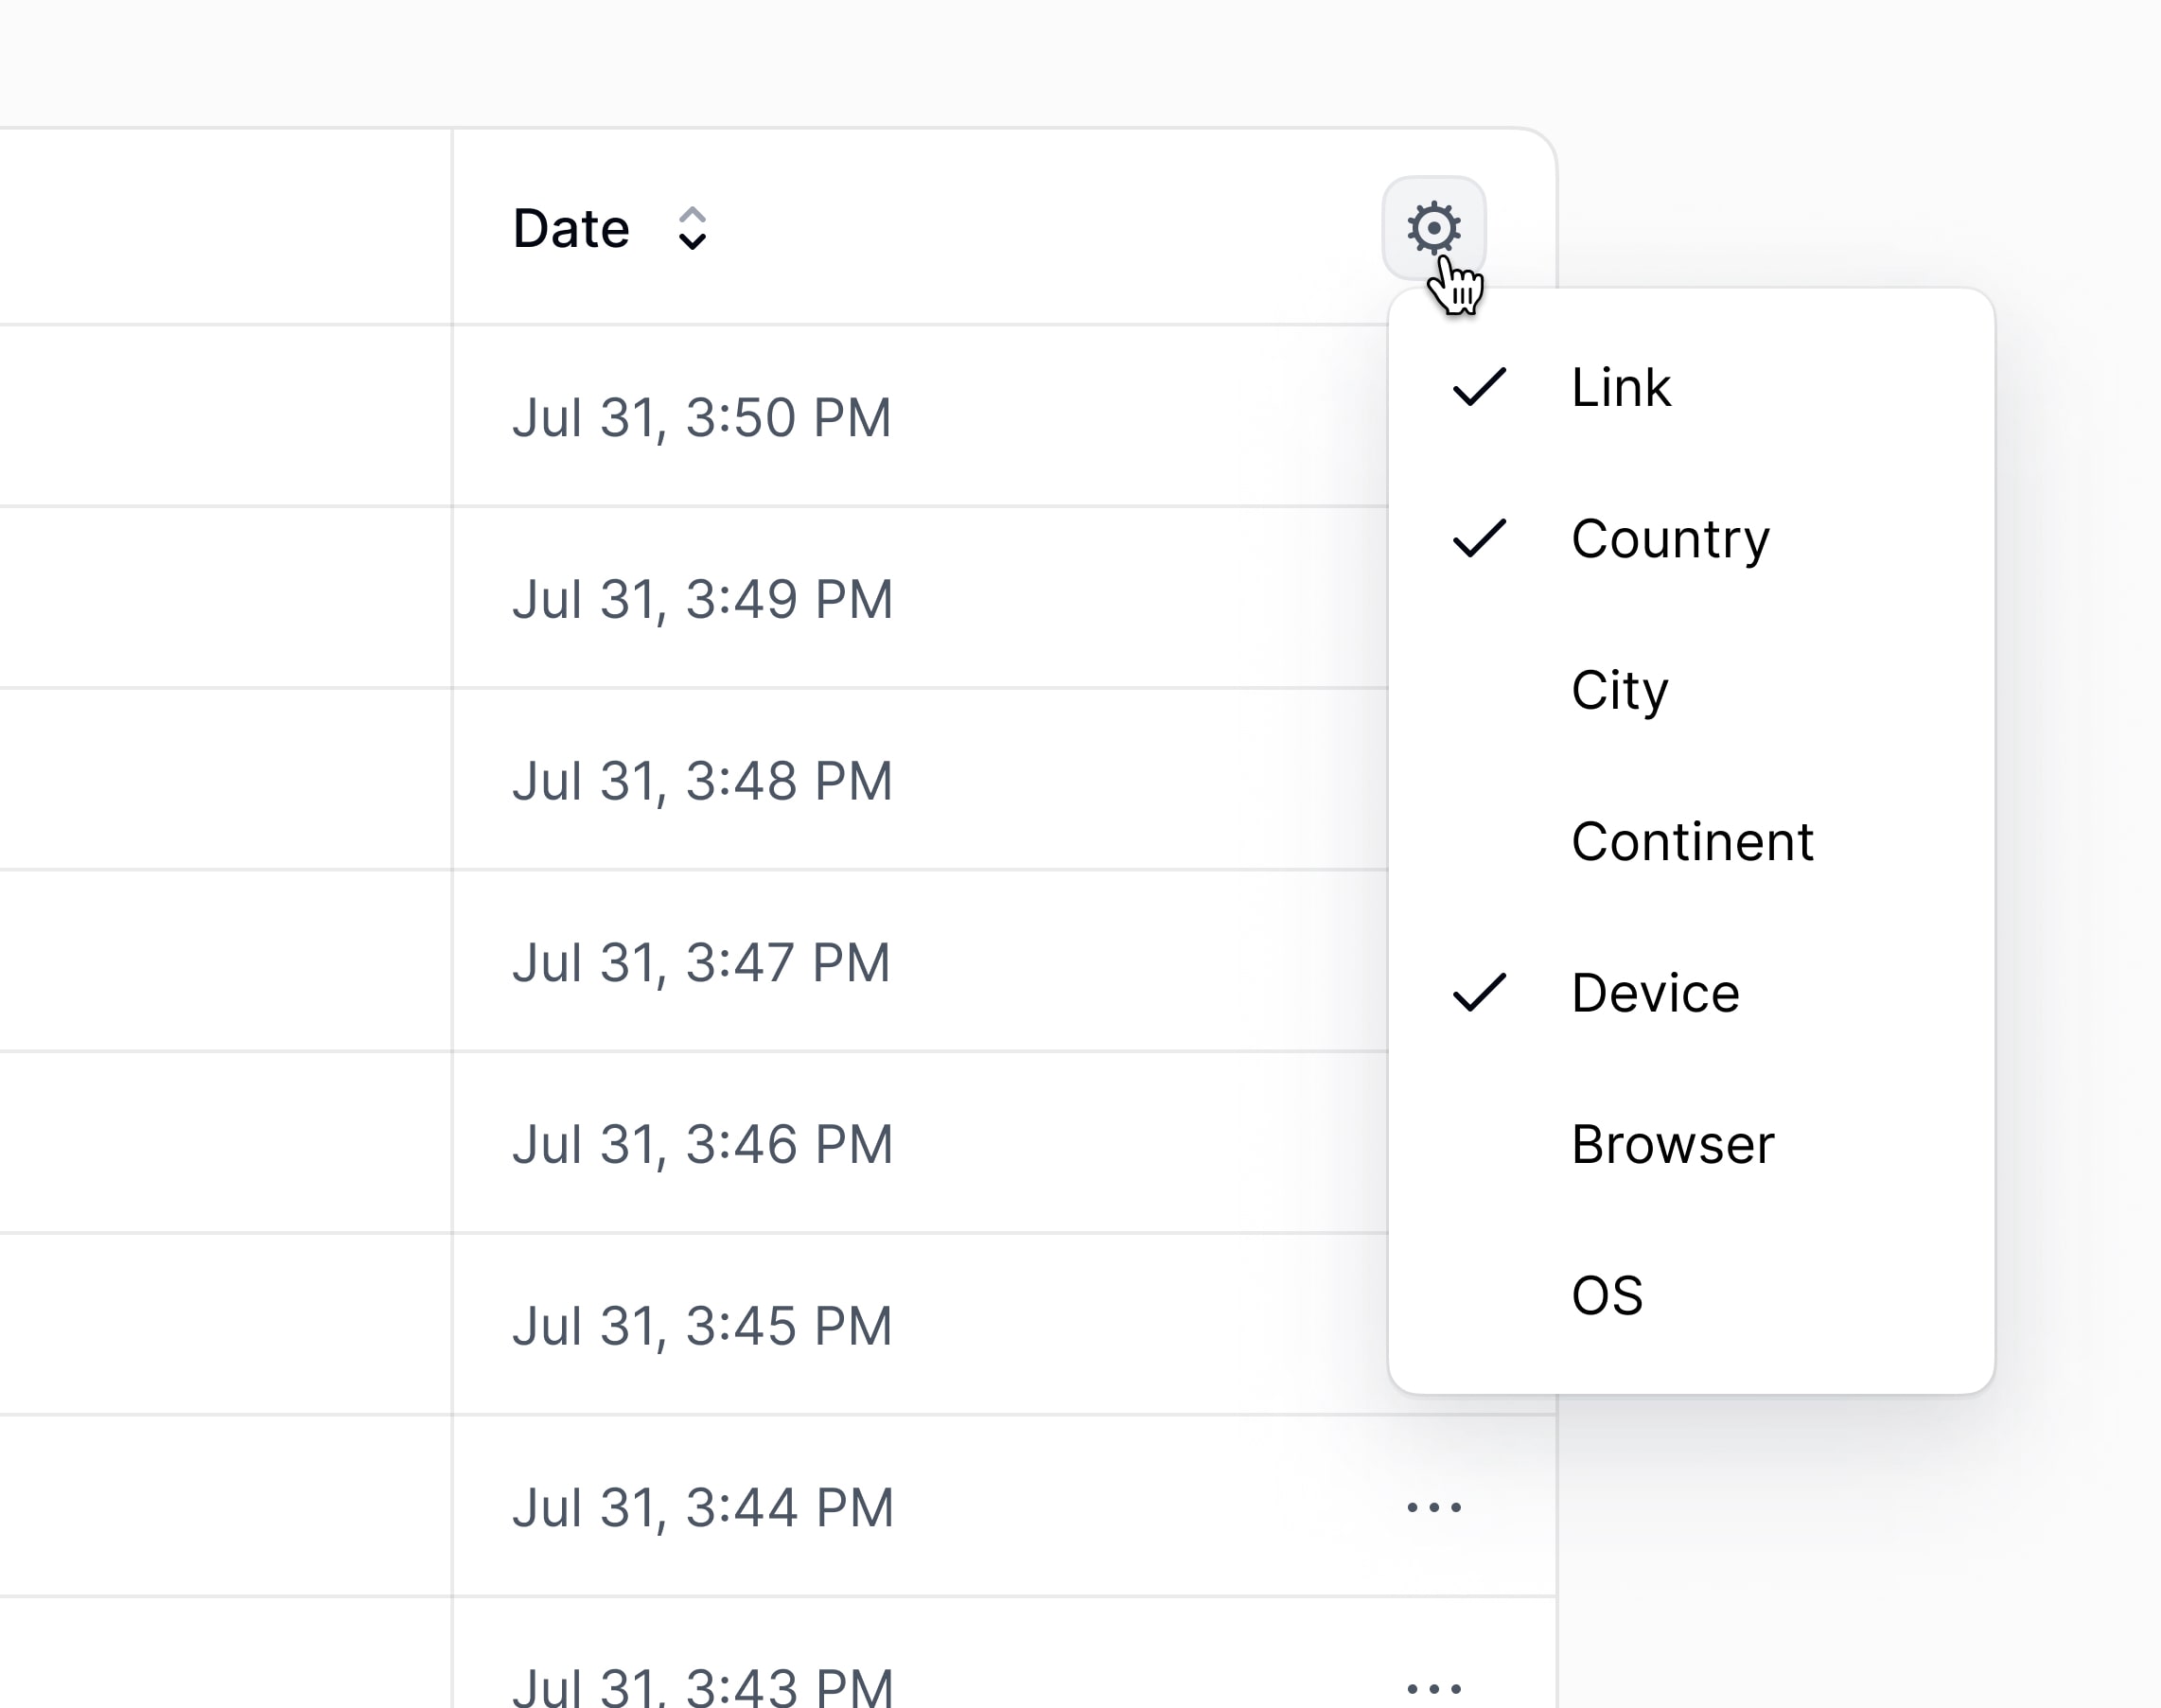 Here are the columns you can choose from:
* **Link**: The link that was clicked/scanned
* **Country**: The country that the event originated from
* **City**: The city that the event originated from
* **Continent**: The continent that the event originated from
* **Device**: The device that was used to trigger the event
* **Browser**: The browser that was used to trigger the event
* **OS**: The operating system that was used to trigger the event
* **Referrer**: The referrer information for the event
* **IP Address**: The IP address that the event originated from (non-EU only)
## Filtering and exporting events
You can also filter the events by the [same filter options as the analytics dashboard](/help/article/dub-analytics#filtering-data).
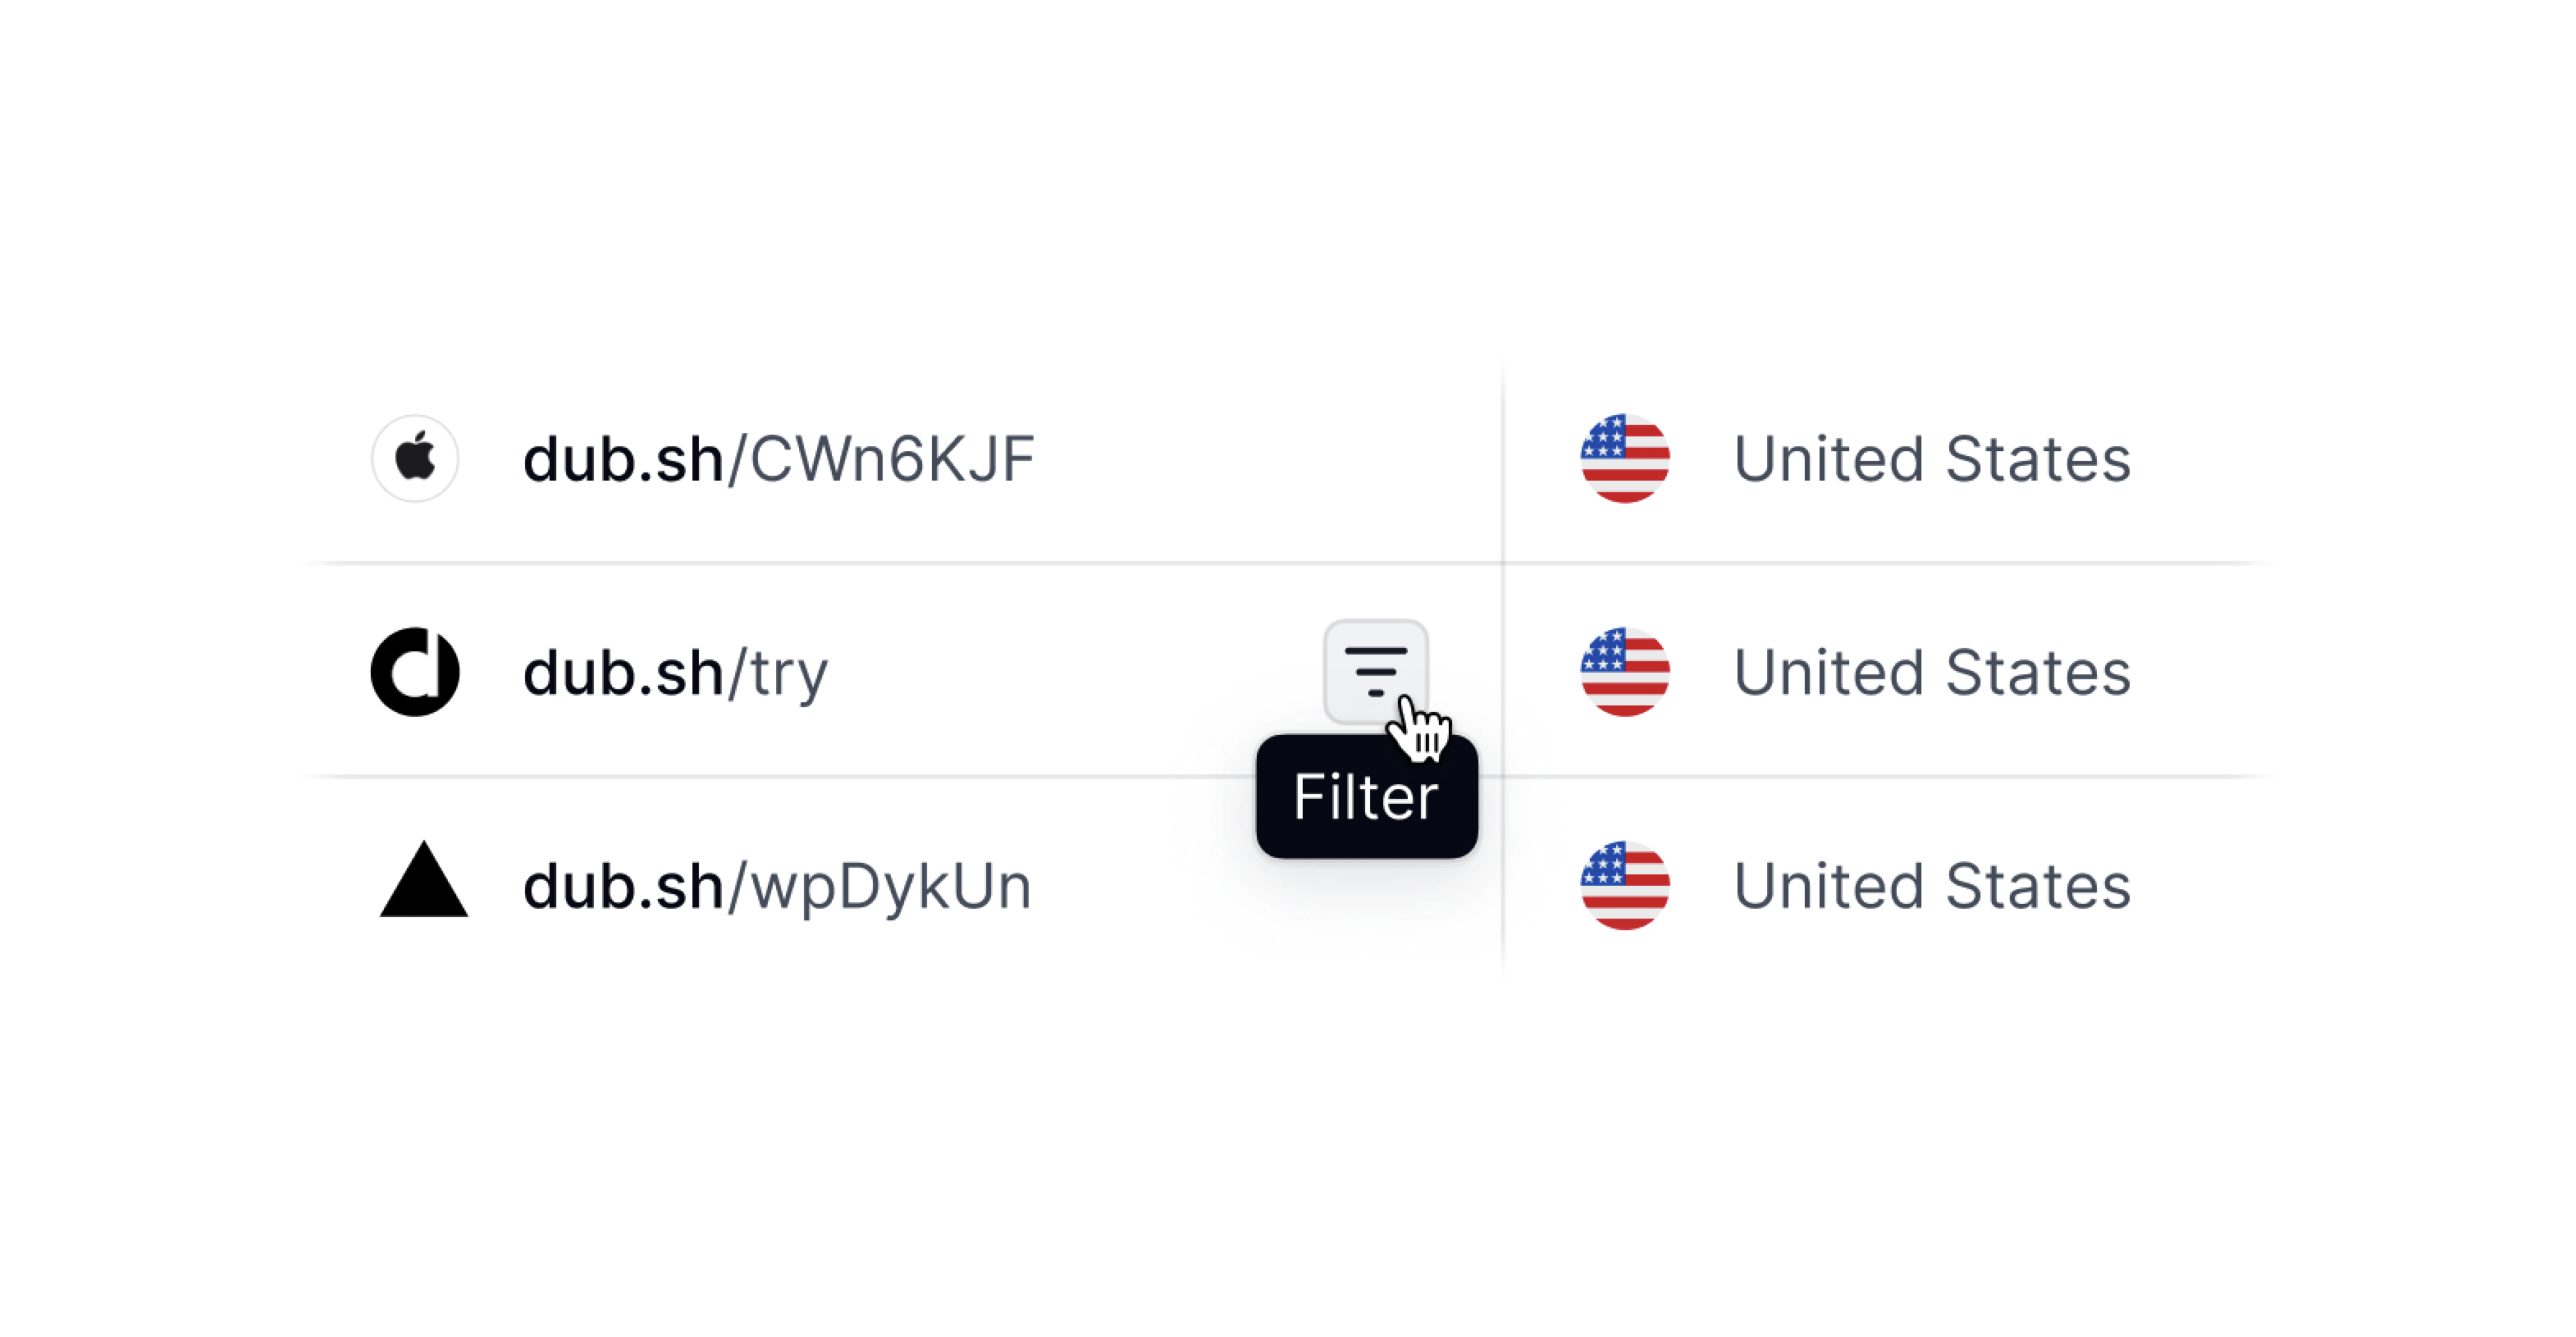
There are two ways you can filter the events stream:
1. By clicking on the **Filter** button in the top right of the dashboard.
2. Clicking on the filter icon that appears when you hover over a given column value.
Here are the columns you can choose from:
* **Link**: The link that was clicked/scanned
* **Country**: The country that the event originated from
* **City**: The city that the event originated from
* **Continent**: The continent that the event originated from
* **Device**: The device that was used to trigger the event
* **Browser**: The browser that was used to trigger the event
* **OS**: The operating system that was used to trigger the event
* **Referrer**: The referrer information for the event
* **IP Address**: The IP address that the event originated from (non-EU only)
## Filtering and exporting events
You can also filter the events by the [same filter options as the analytics dashboard](/help/article/dub-analytics#filtering-data).
There are two ways you can filter the events stream:
1. By clicking on the **Filter** button in the top right of the dashboard.
2. Clicking on the filter icon that appears when you hover over a given column value.
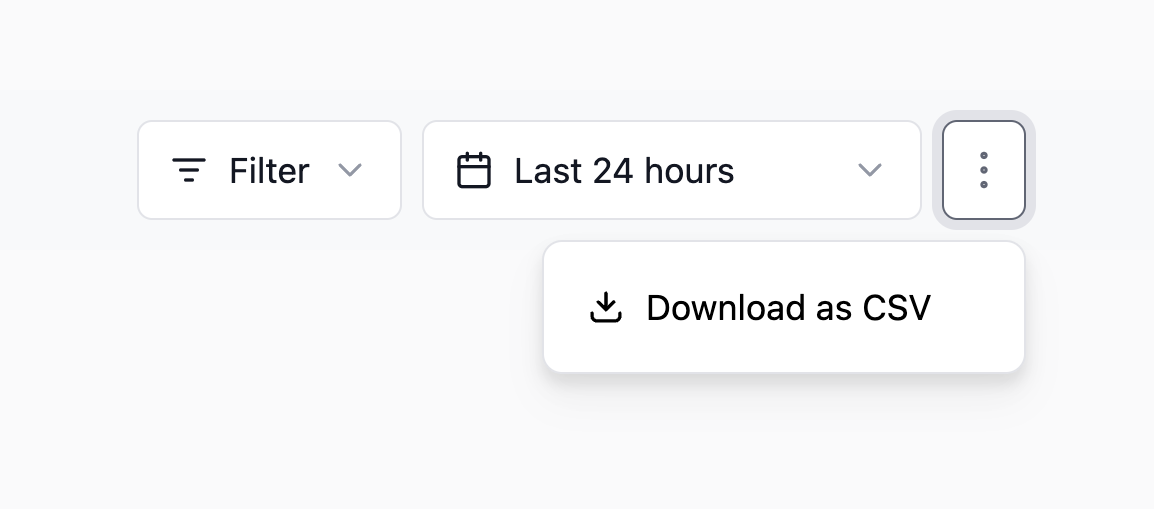
 Once you've filtered the events to your liking, you can export them by clicking `⋮` button and selecting **Download as CSV**.